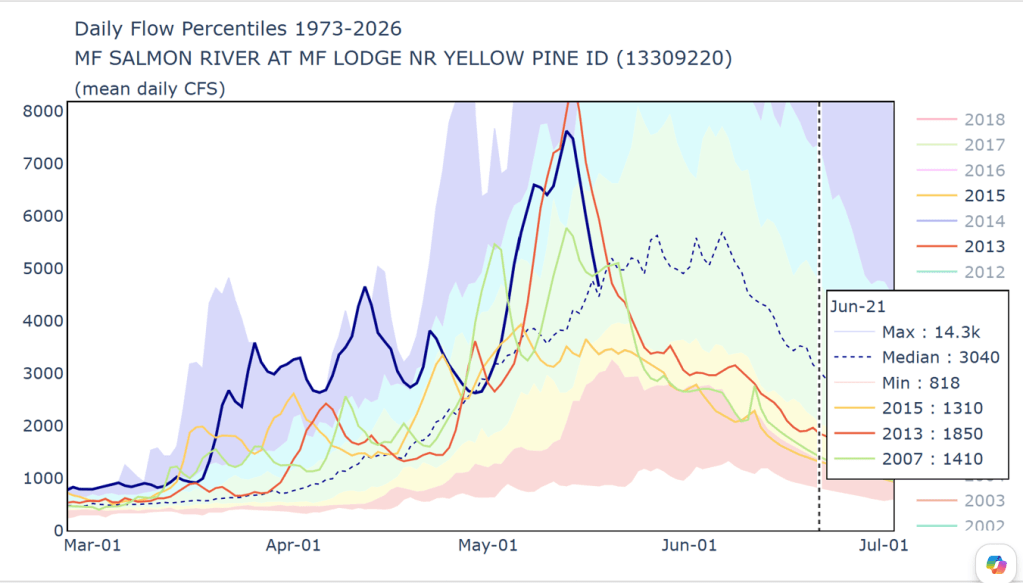
Mid-June update and the Bruneau and Owhyee are tracking their record low levels from 1992.
Here’s a few updates for Idaho’s favorite rivers and bonus graphs for the Green, Grand Ronde and Salmon Falls.
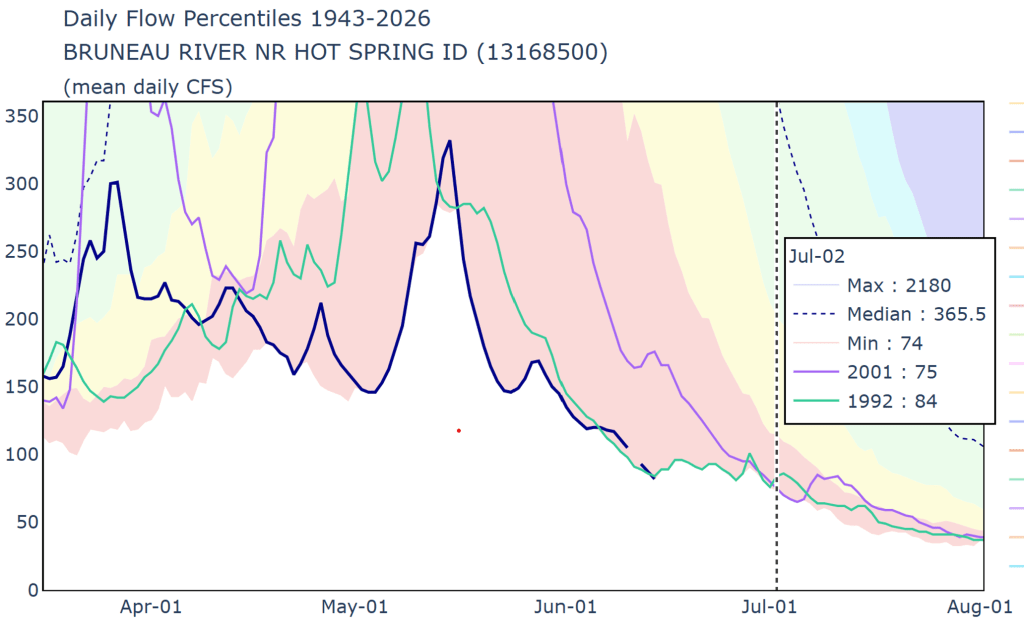
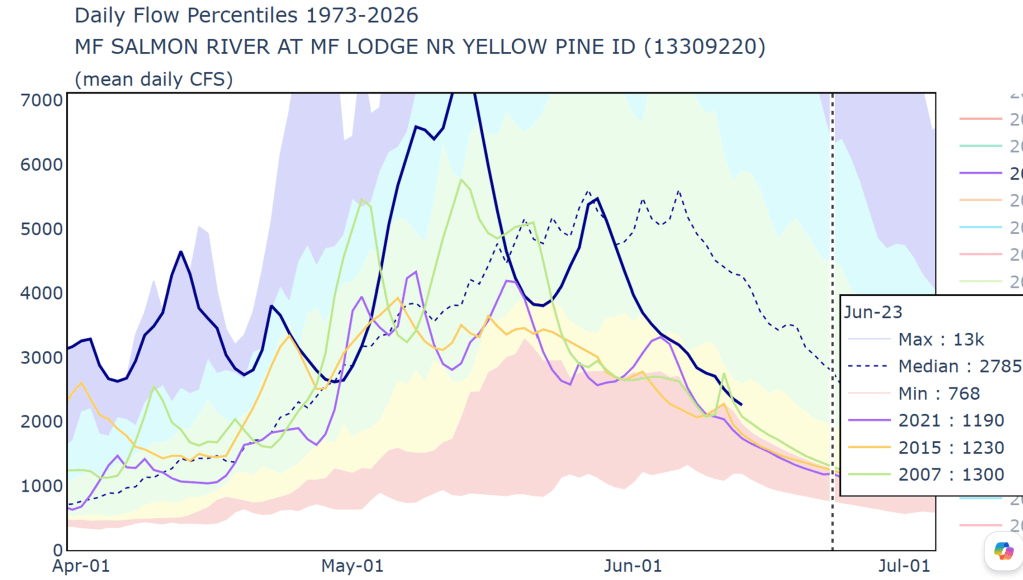
Mid-June update and the Bruneau and Owhyee are tracking their record low levels from 1992.
Here’s a few updates for Idaho’s favorite rivers and bonus graphs for the Green, Grand Ronde and Salmon Falls.
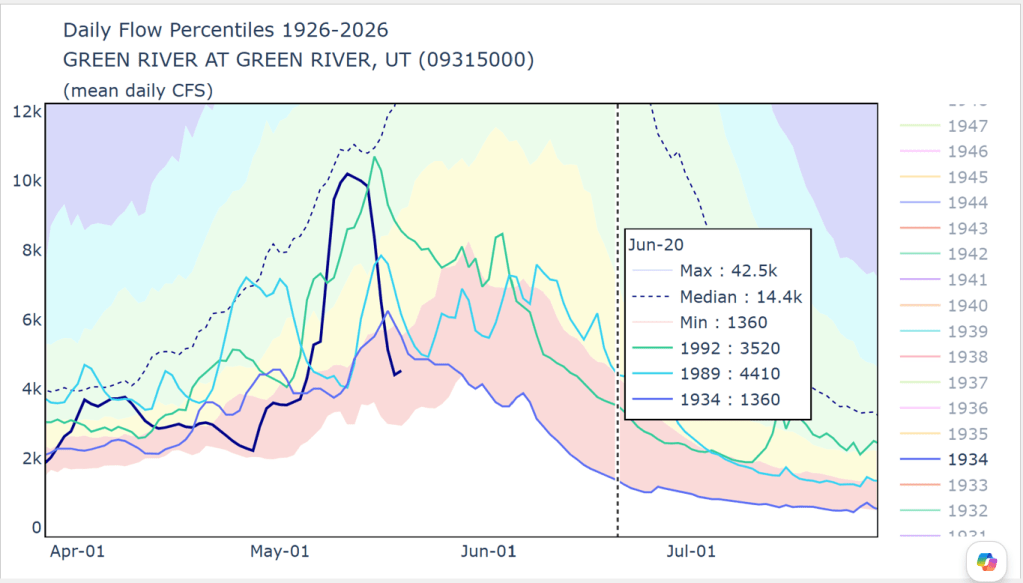
Only looked for similar flow levels, didn’t look at any remaining snow levels. Green River is interesting with comparison to 1934, which was also a warm winter in Idaho.
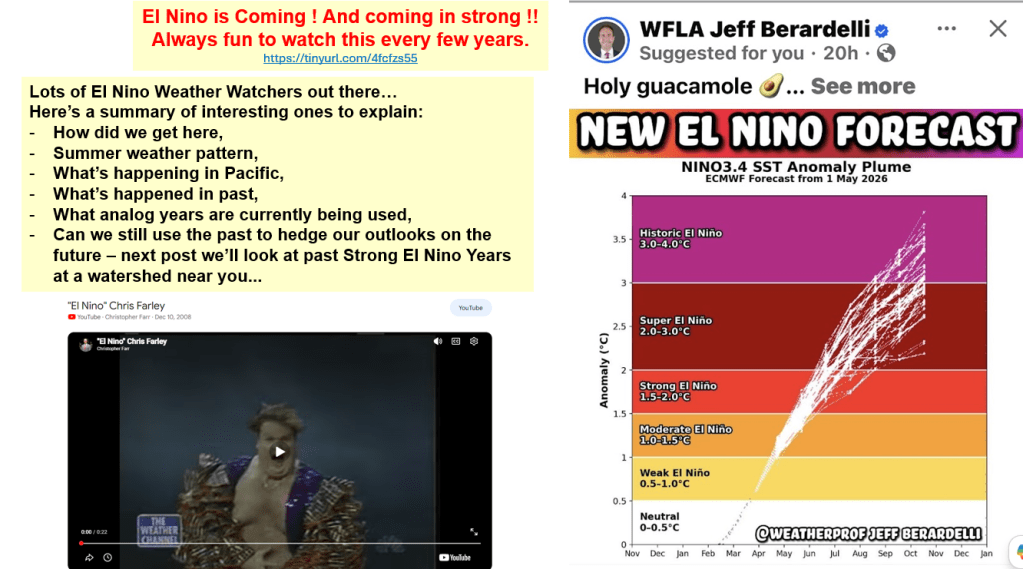
Now that the snow has melted and rivers peaked or peaking, let’s talk about next winter. Here are highlights about this developing Super El Nino and how we got here. Next Post – we’ll look at the details and zoom into your local watershed to see what happened in past Supper El Nino years as we wait to see if history will repeat itself !
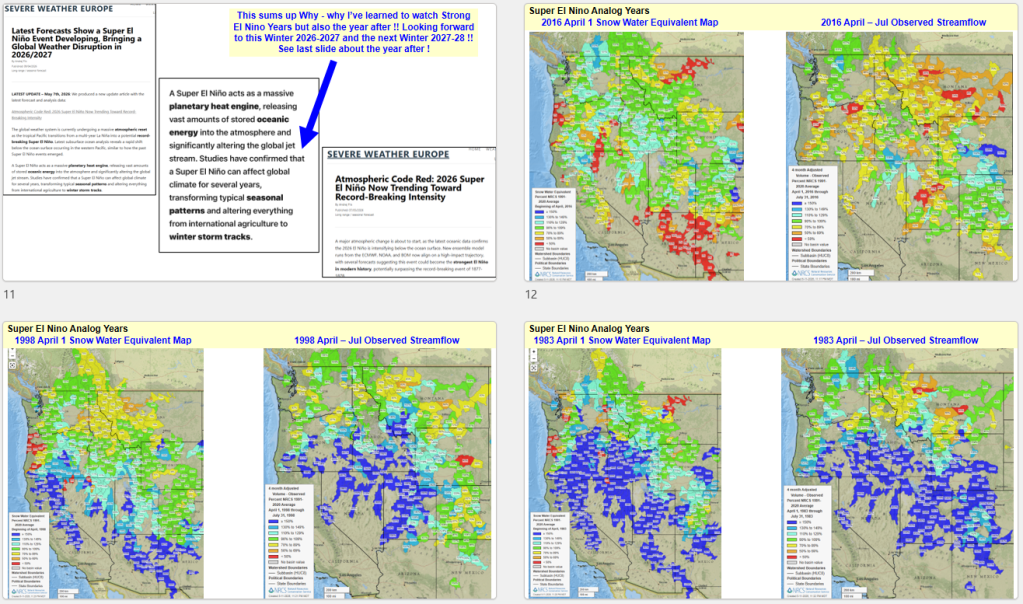
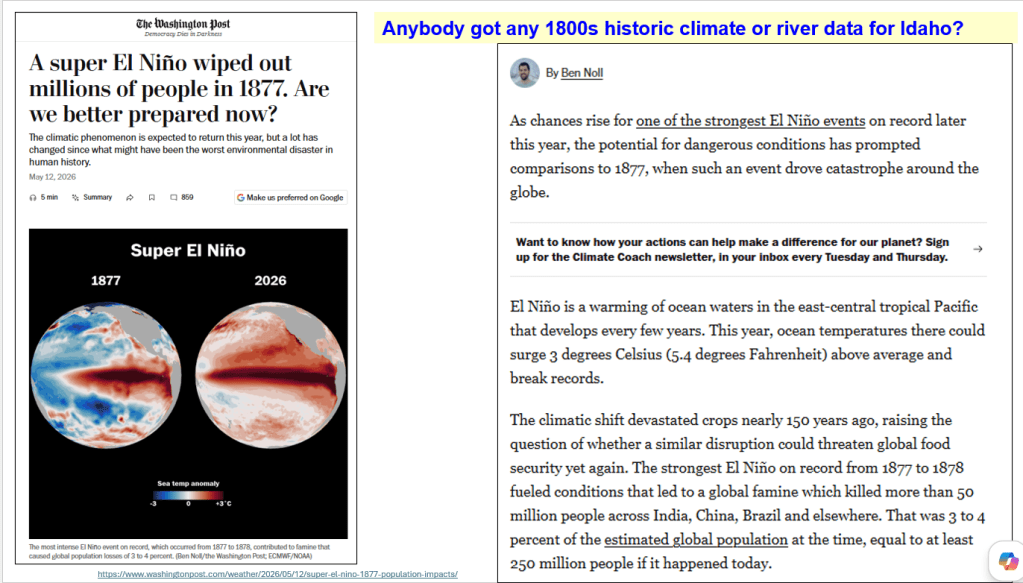
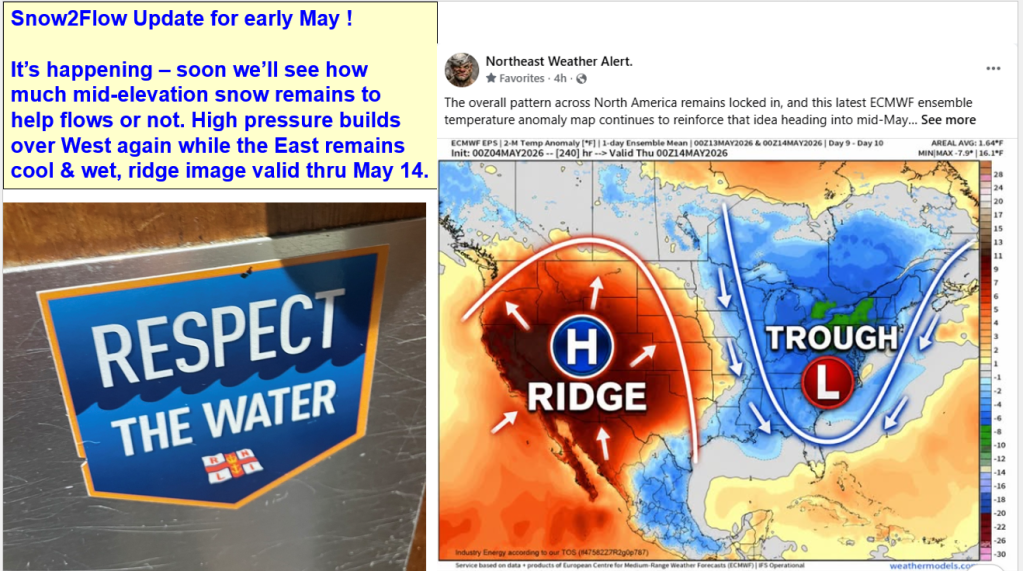
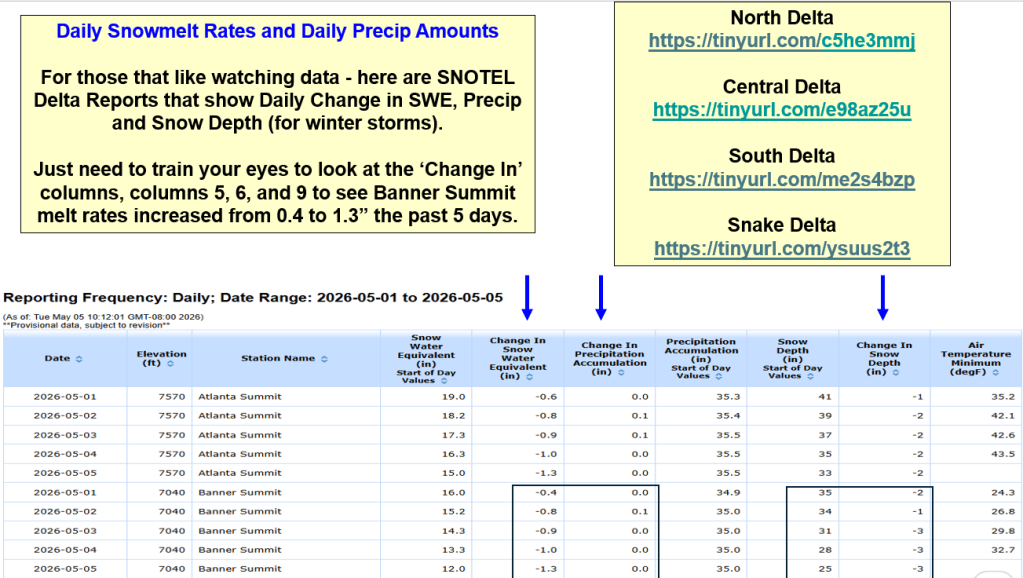
It’s Happening ! Details are in the data and if you like data, checkout the SNOTEL Delta Reports to watch daily snowmelt rates increase from half an inch a day to 1″/day. And if the sites are melting 2″/day for several days, you know the rivers are rocking while there’s snow to feed `em. Be safe, enjoy the ride and Respect the Water !!!
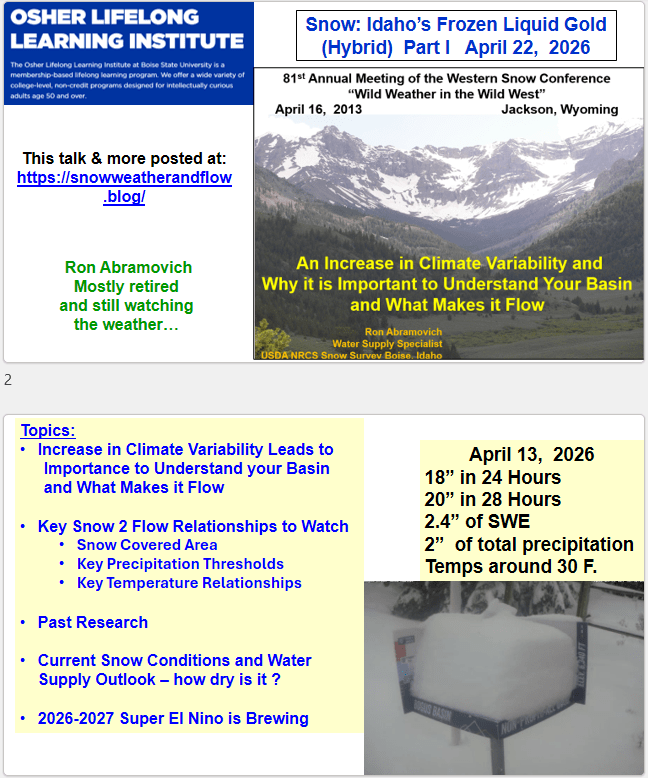
This Part II talk was given at Osher Lifelong Learning Institute on April 22 about importance to understand your basin, key indicators to watch and current snow to flow information. More detailed snow and flow info is included for Boise, Salmon Falls, Bruneau, MF, Main Salmon, Selway and a preview of next winter’s El Nino that is brewing.
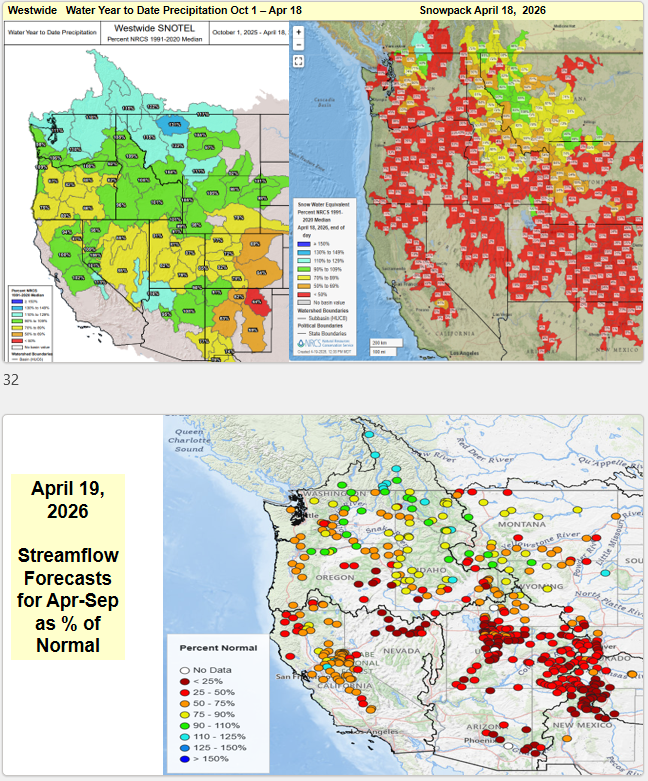
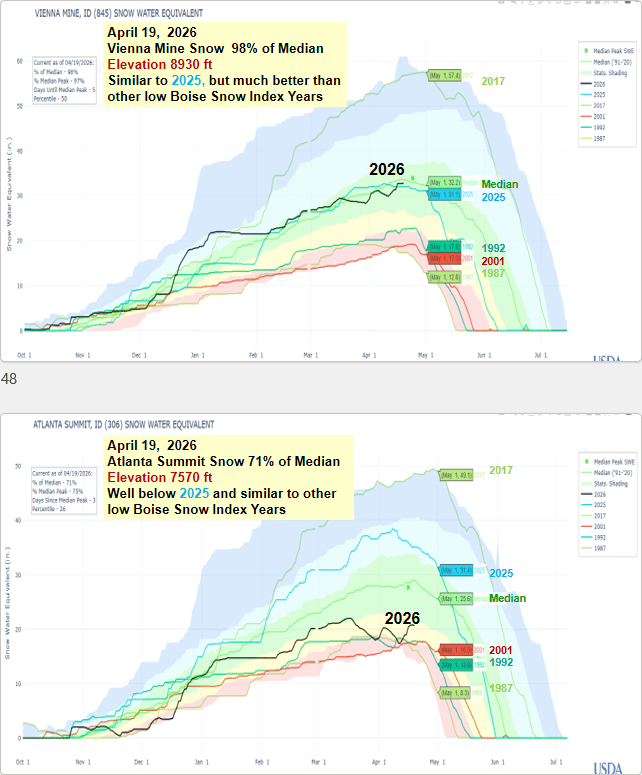

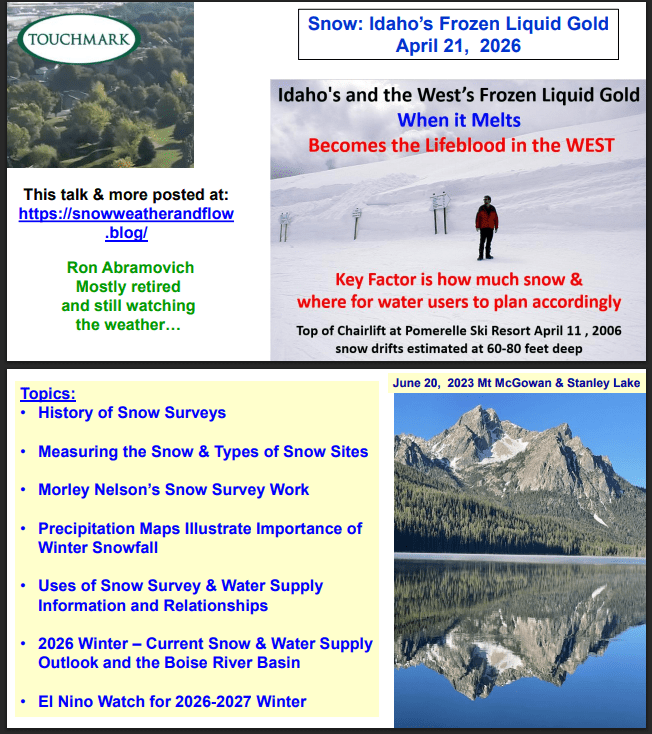
Here’s a Touchmark talk about history of Snow Surveys, Importance of Snow in the West and Current Conditions / Outlook for the Boise Basin. This weird interesting winter just keeps getting more interesting with each storm as the mountain snow tries to melt…
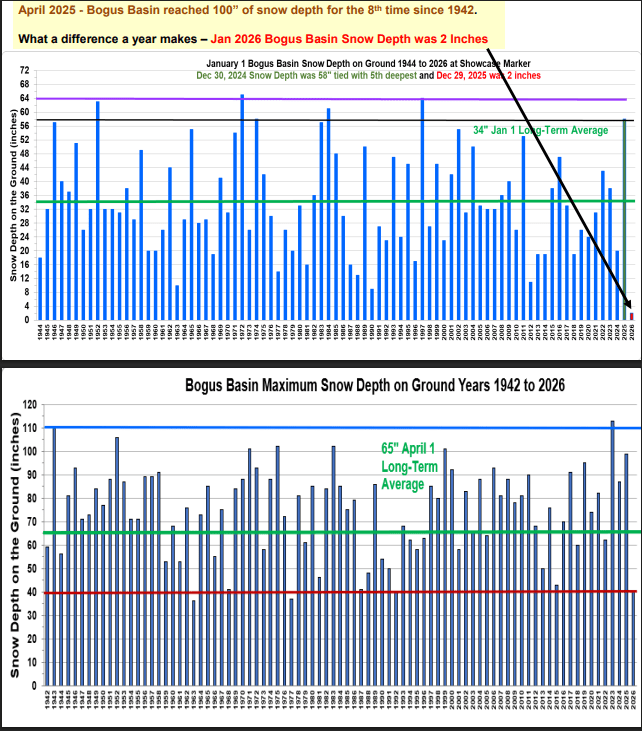
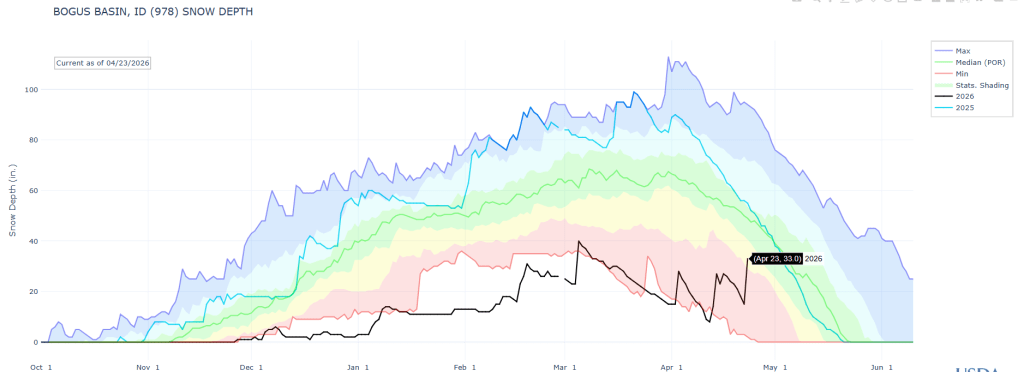
One more storm may exceed the 40″ max snow depth in early March.
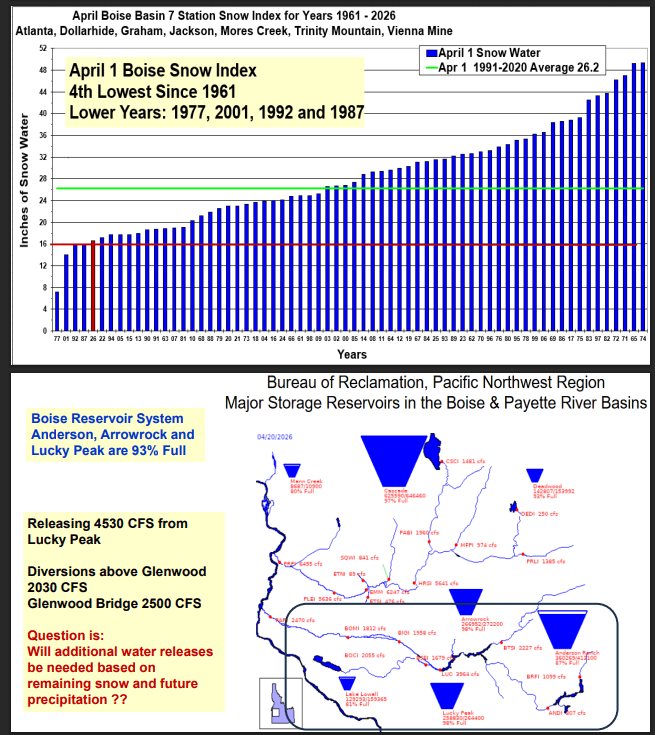
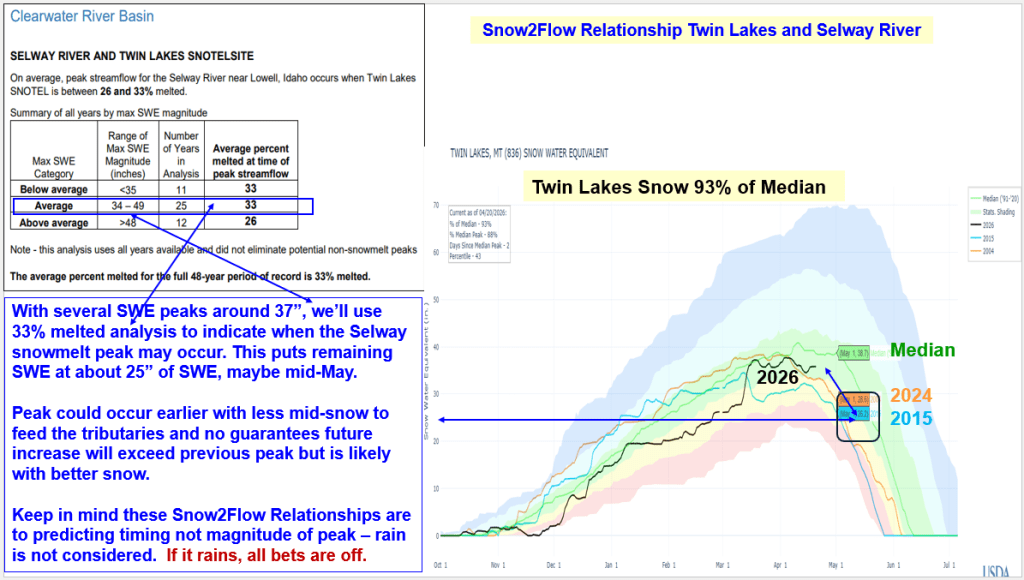
Now this is getting interesting… Usually our western mountain snowpack reaches its peak Snow Water Equivalent (SWE) in early April – not this year the pack peaked in mid-March under the early season Heat Dome. And now some of the rivers have also seen their snowmelt runoff peak. Seems like the snow and flow cycles are 2-3-4 weeks ahead of normal primarily from those warm temps. The Owhyee forgot to peak this year and is flowing at record lows levels very similar to 1992. The Bruneau rose last week and time will tell if there’s another snow increase.
An interesting observation in the Salmon and Selway basins is how much snow melted to provide March flows. This snowmelt was not just from mid-elevations but also higher elevations that are melting. So considering most of the streamflow volume forecasts are for the April-July period, does this shift of runoff into March mean the observed April-July volumes will be less and low summer base flows will occur even early this year. Is it time to consider shifting the primary forecast period from April-July to March-July?
This week’s last winter storm is just what is needed to slow the melt, add a little moisture to the pack, and rain on the soils as the snow melts. A cool wet spring would be ideal along with spring storms. Remember Yellowstone June 2022 and June 1963 Owyhee rain event pushed the river up to 5000 cfs. The least we need is another near record dry April-May-June precipitation like we saw last spring.
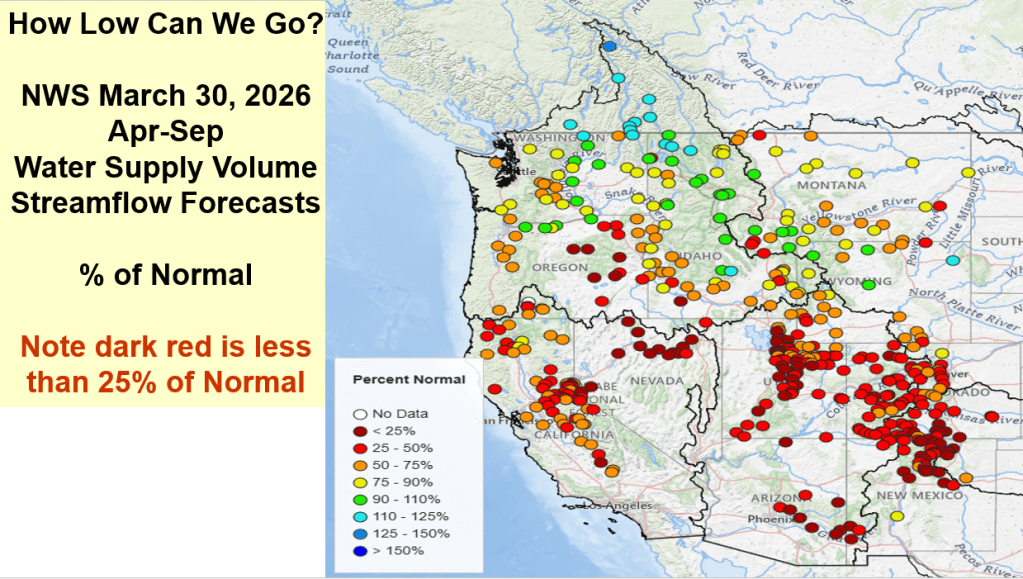
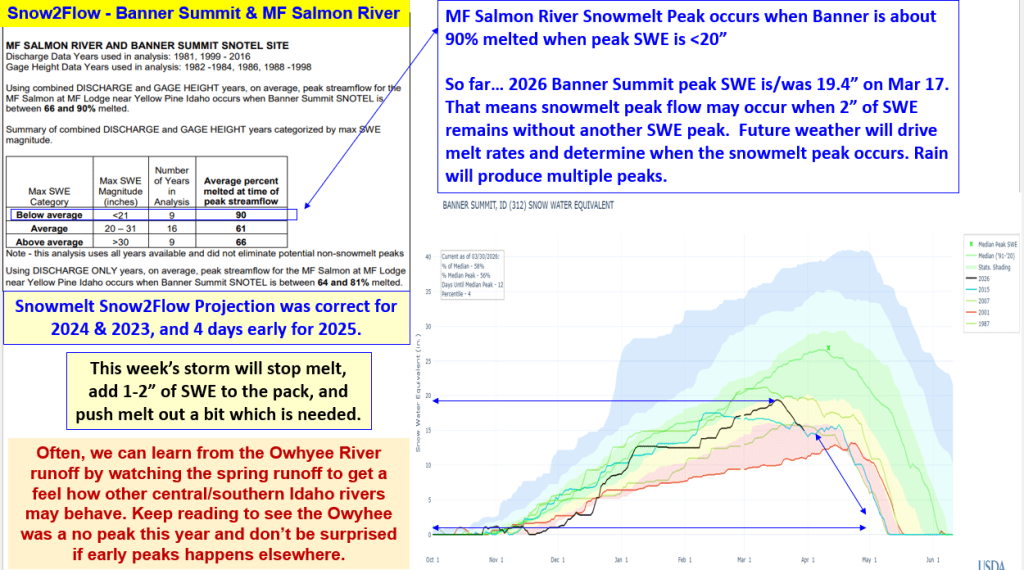
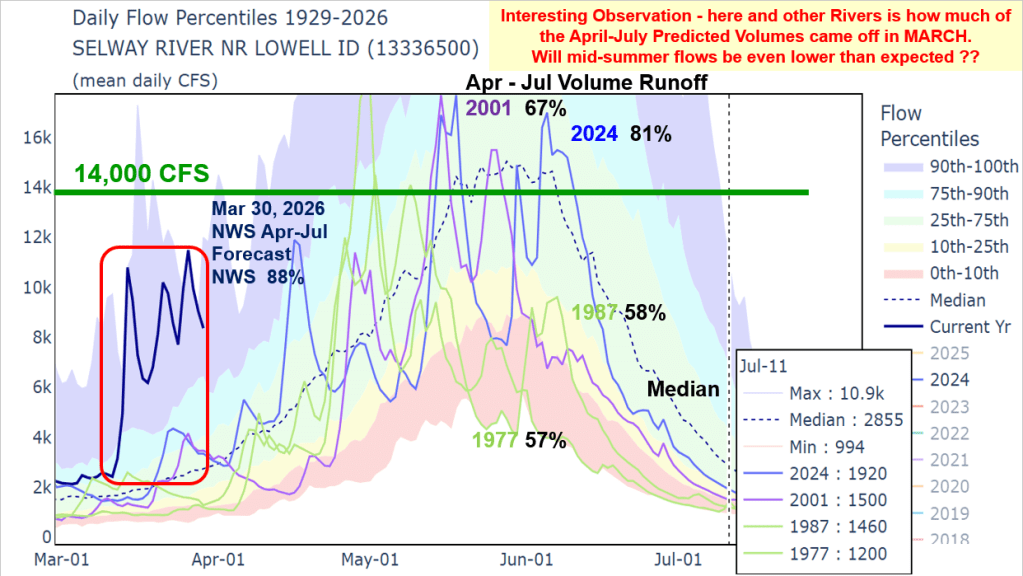
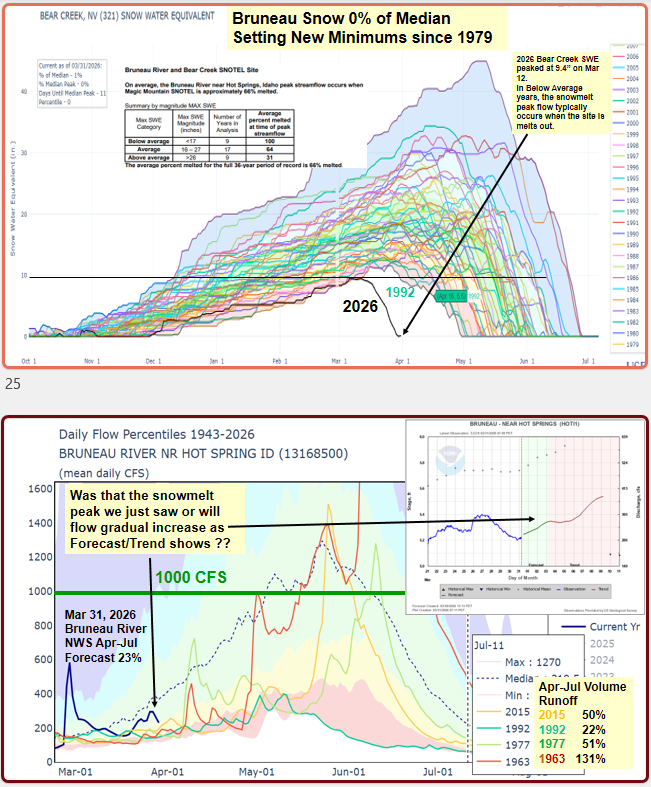
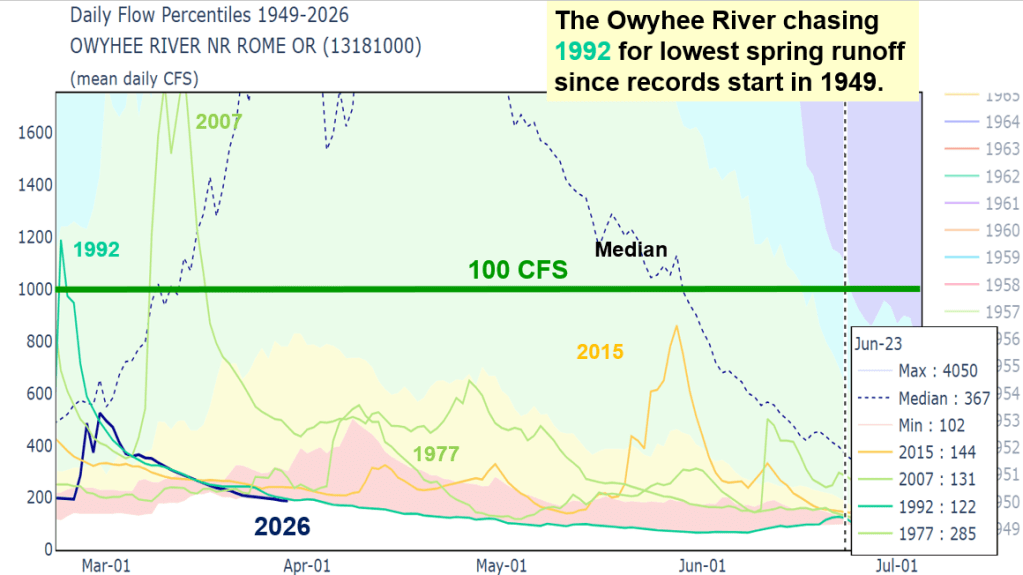
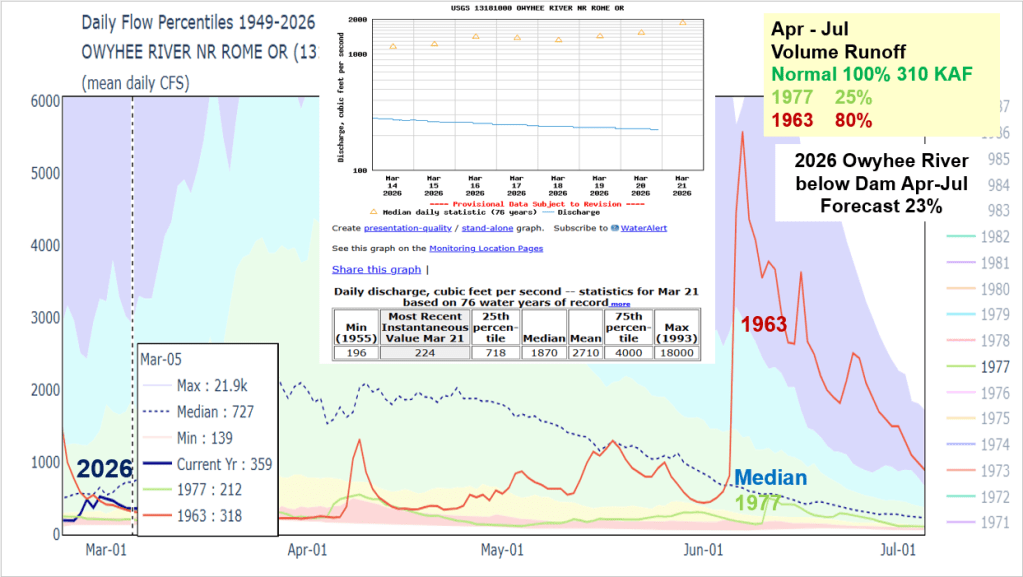
Mid-March heat dome is melting Idaho’s snow way too earlier. Even the higher elevations are starting to melt and rivers are rising. Here’s an update of how we got here and the 3-D Drought that put us in this unique position. Winter 2026 will be remembered as a winter with near normal water year to date precipitation, elevation distributed snowpacks, warm temps and now a spring heat dome that is melting the snow and pushing rivers up, except in the Owyhee because there is very little snow to melt. Let’s hope cooler weather returns by month’s end and a few cool wet storms in Aril arrive to save our remaining higher elevation snow to melt later this spring. A wet spring is needed this year. Another record dry Apr-May-Jun like last year, would not be good. Spring rain are needed now while the snow is melting to increase runoff. Even a late spring rain event like the one that occurred June 1, 1963 pushing the Owyhee River up to 5000 cfs, would be sweet. 1963 is an analog year for this year which also had very low snow runoff in the Owyhee. Lessoned learned from watching Owyhee River runoff – it often sets the stage for runoff trends seen elsewhere in southern Idaho.
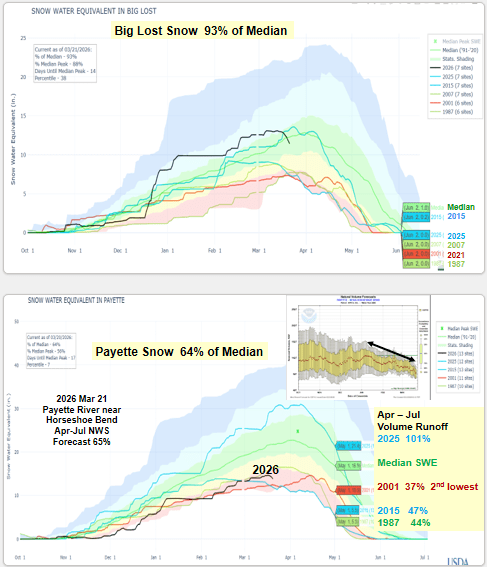
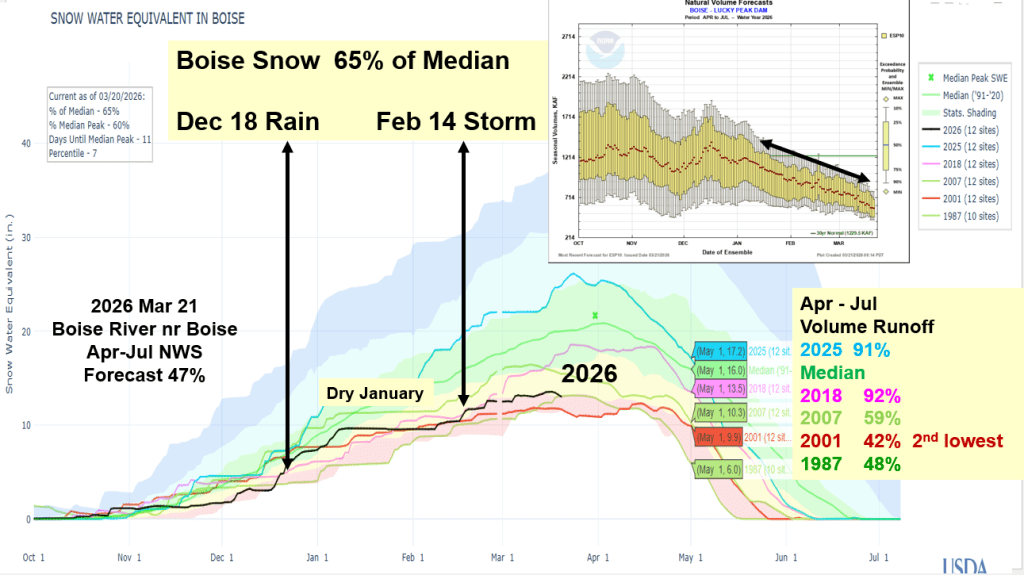
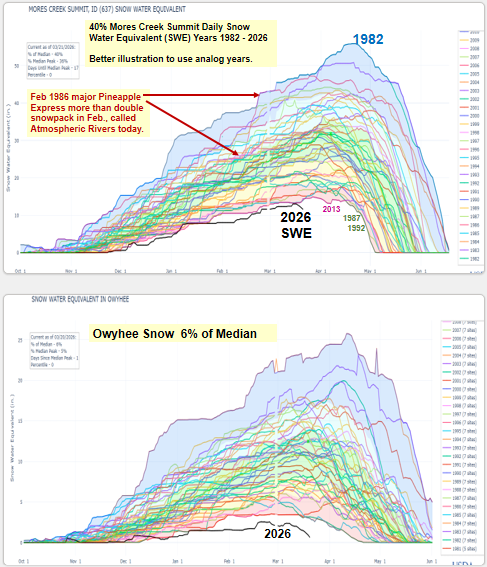
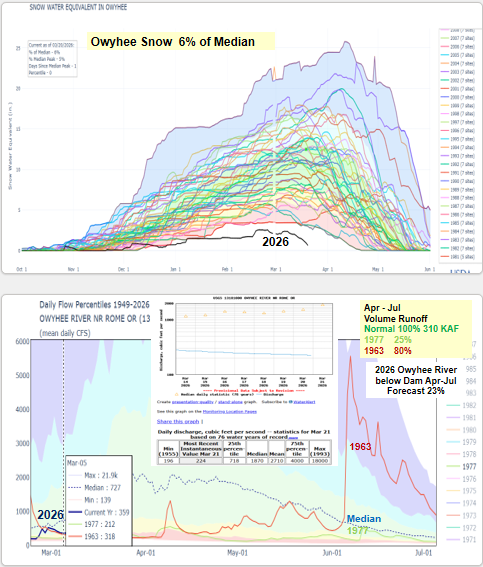
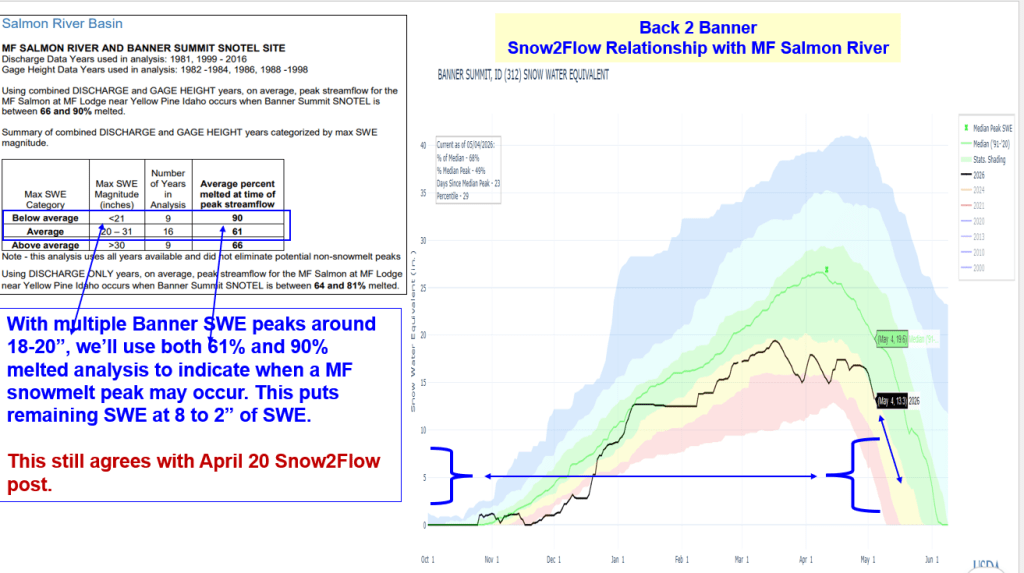
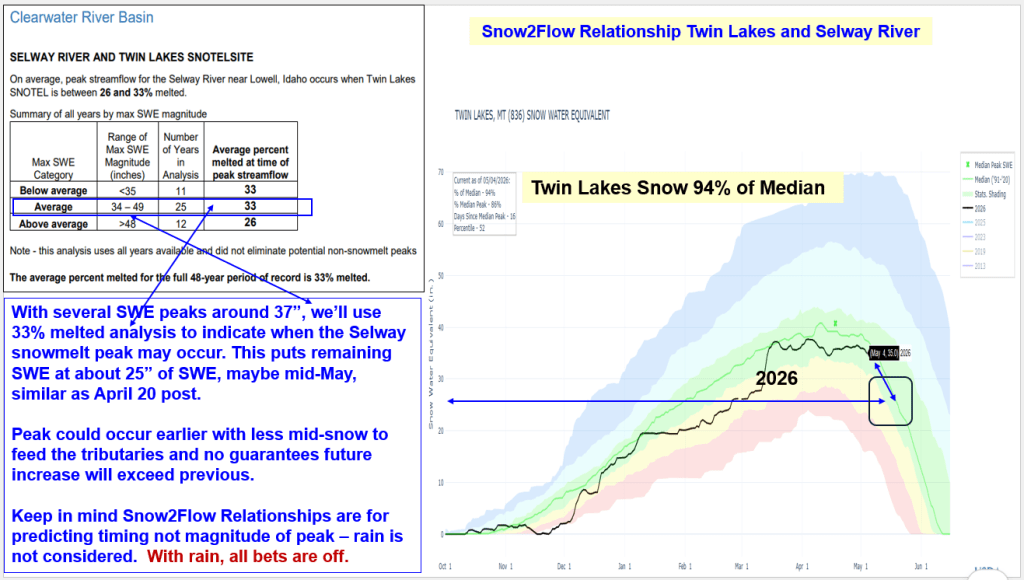
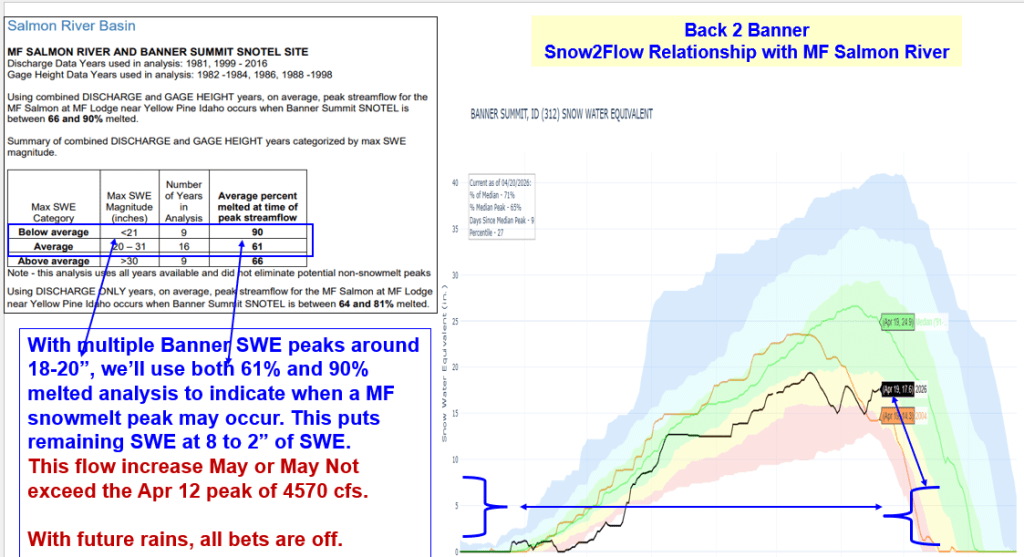
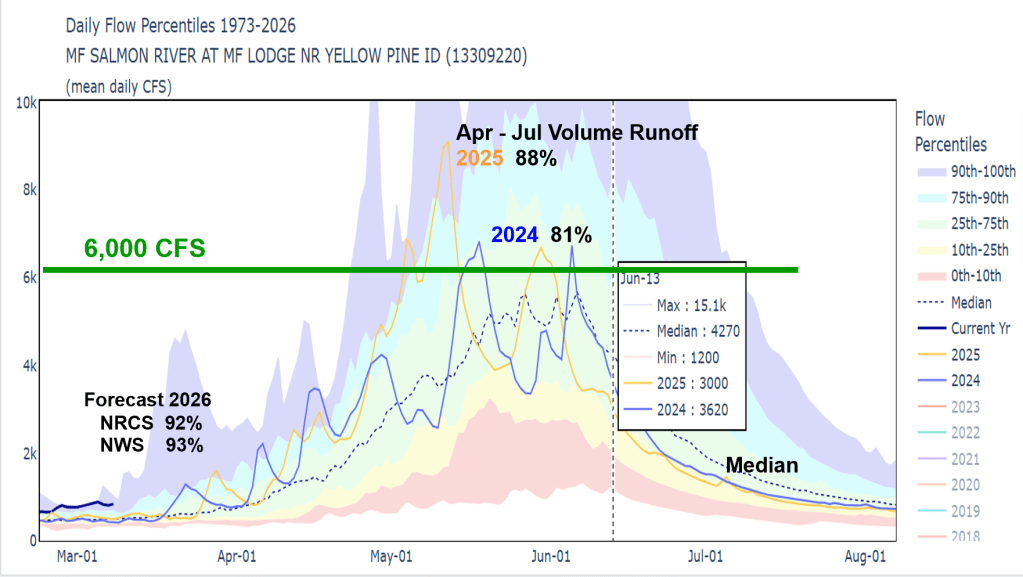
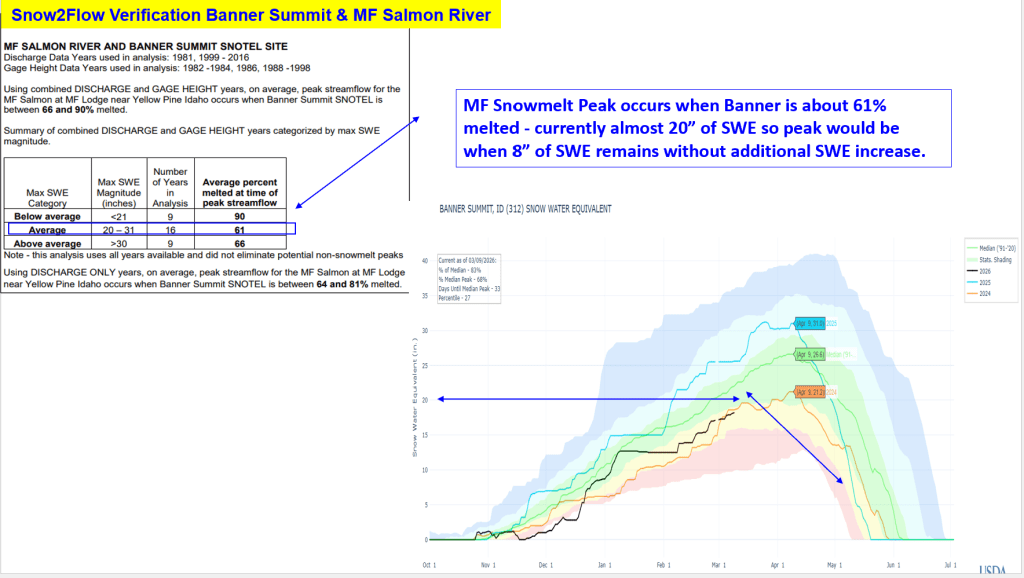
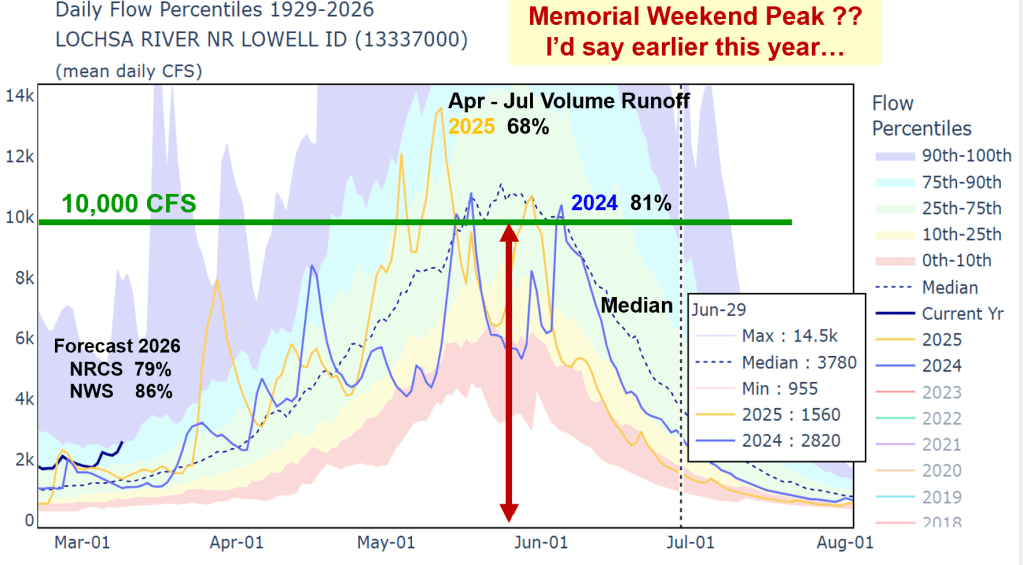
Here’s a Snow 2 Flow Update for the coming season. And remember to check out this Snow2Flow Verification post about using snowmelt rates to help prediction snowmelt peak flow dates or see if the peaks have passed. https://snowweatherandflow.blog/2026/01/22/snow2flow-verification-for-years-2023-24-25/
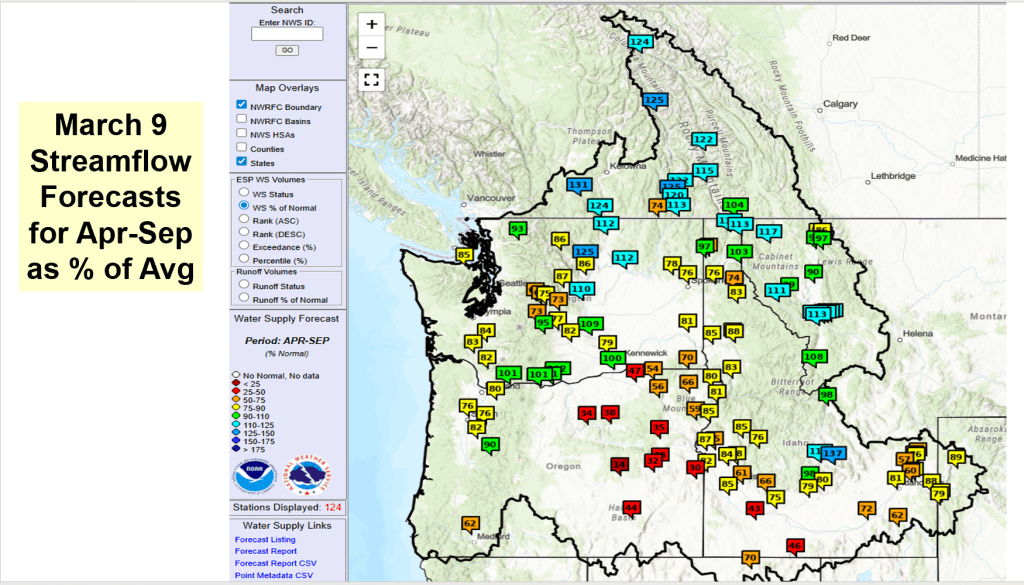
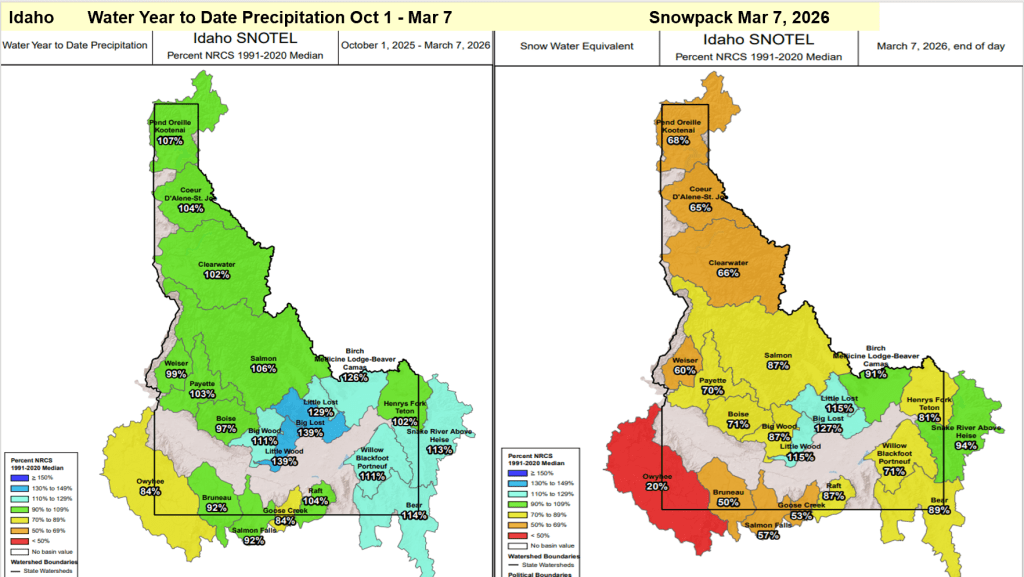
Ski ya later !!
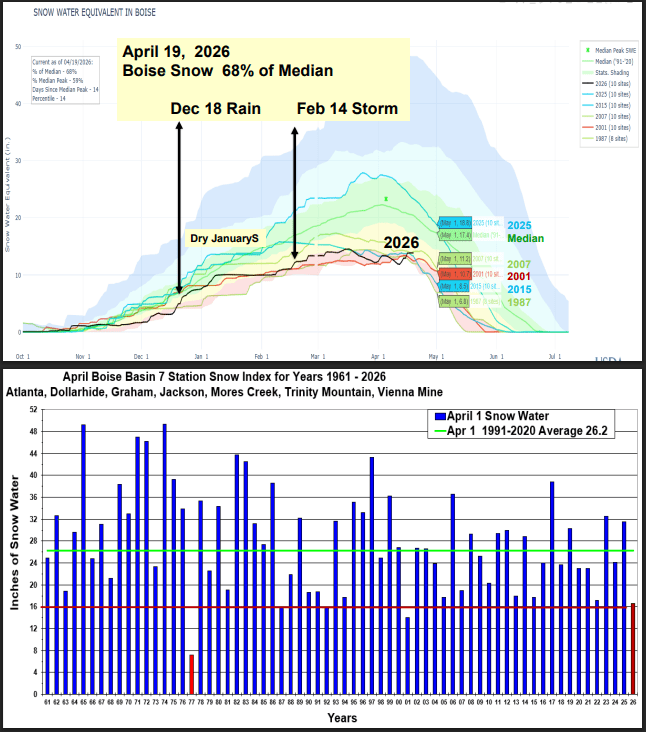
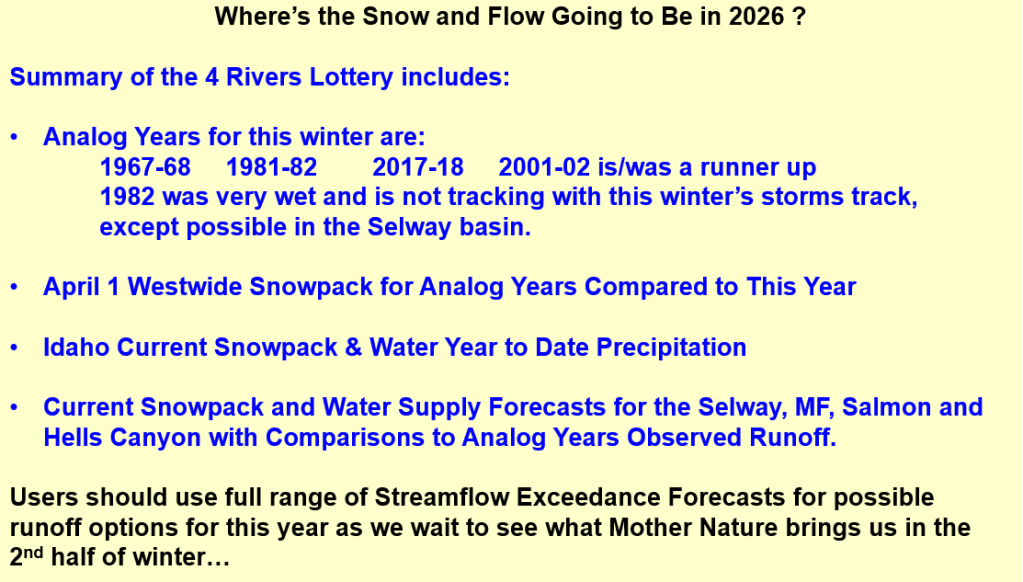
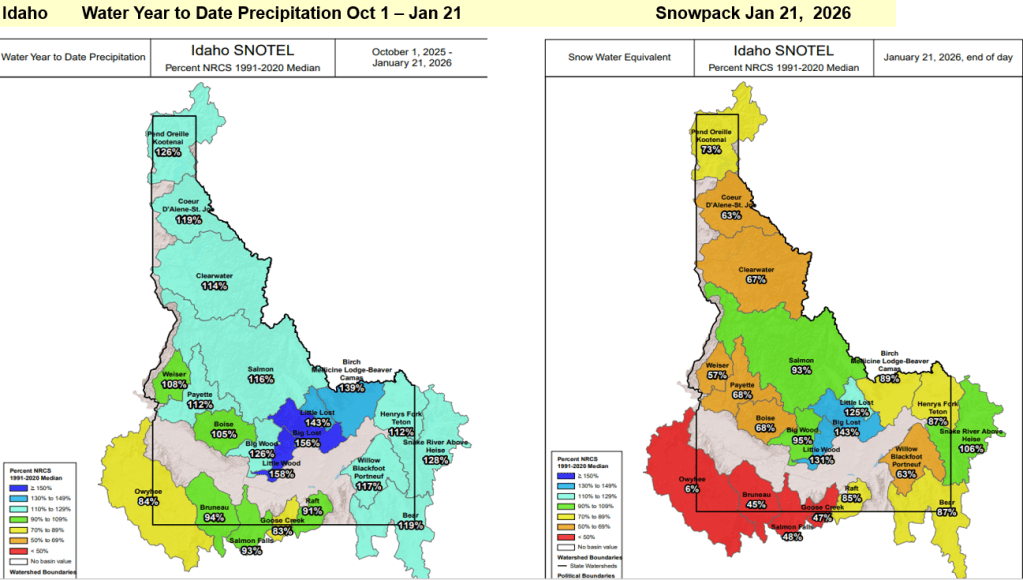
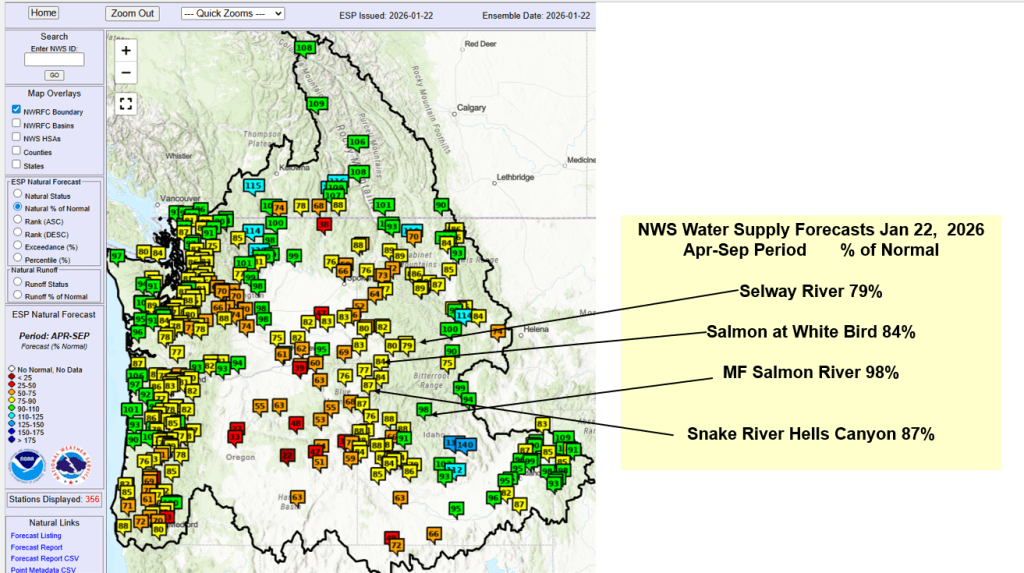
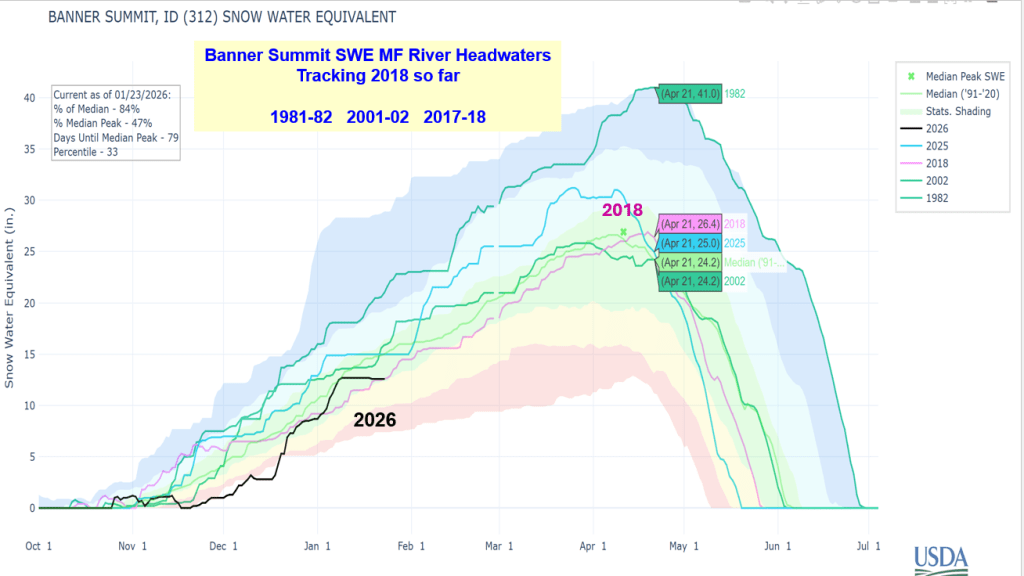
Here’s a summary of current snow water supply conditions for Idaho’s 4 River Lottery Rivers. Short on time for complete analysis but this should provide current info about the accumulation of this winter’s unique snowpack and where we are compared to other years.
 Snow Weather and Flow