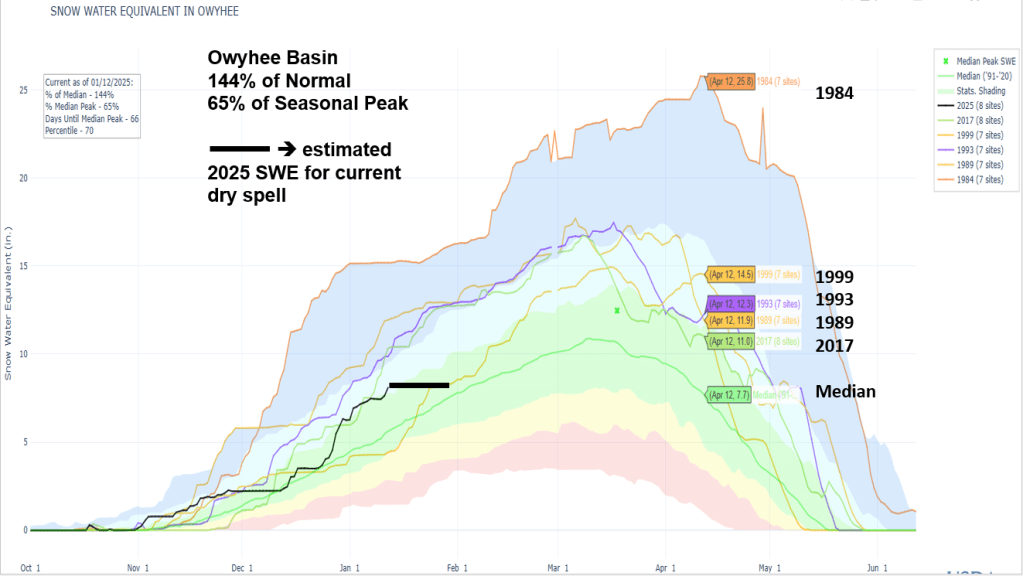
Here’s a talk given to Idaho Alfalfa & Clover Seed Growers about current conditions, analog years, acres burned, a few slides about 2024 extreme weather and disasters, and the snow & flow outlooks for the Weiser, Payette, Boise and Owyhee basins. With high, dry and cold weather here for a bit, we’re gonna loose about 1% a day, but the snow won’t be melting. Cold is good! We’ve seen winter dry spells in other years and lucky for us, SW Idaho got off to a great start this winter. Let the 2nd half of winter start – any day now…
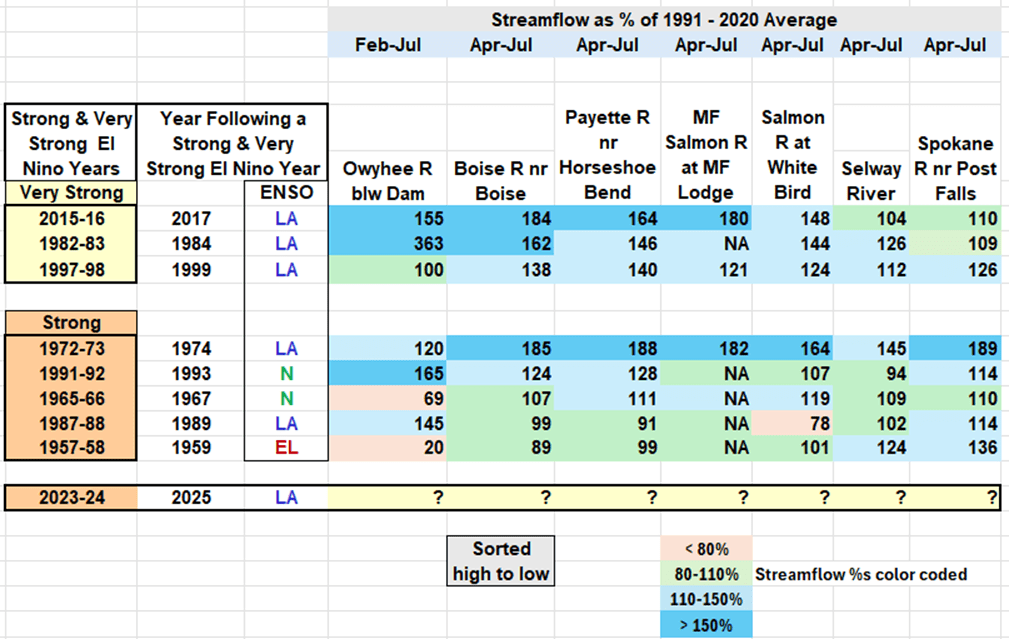
With more snow accumulating in our mountains, let’s look at how this year compares with other years that follow Strong El Nino Years. In the past, we’ve had some good snow and flow years following Strong El Nino Years. The easiest way to explain this is – it seems the oceans and atmosphere has a lot of energy to get rid of the following year. Let’s see if we can still use the past to predict the future and how the snow is tracking.
Here’s our new table of Strong and Very Strong El Nino Years and the years that follow. You can quickly see by the color shading that only a few are below 80% of average, and rest are near average, above average or outstanding with greater than 150% of average runoff.
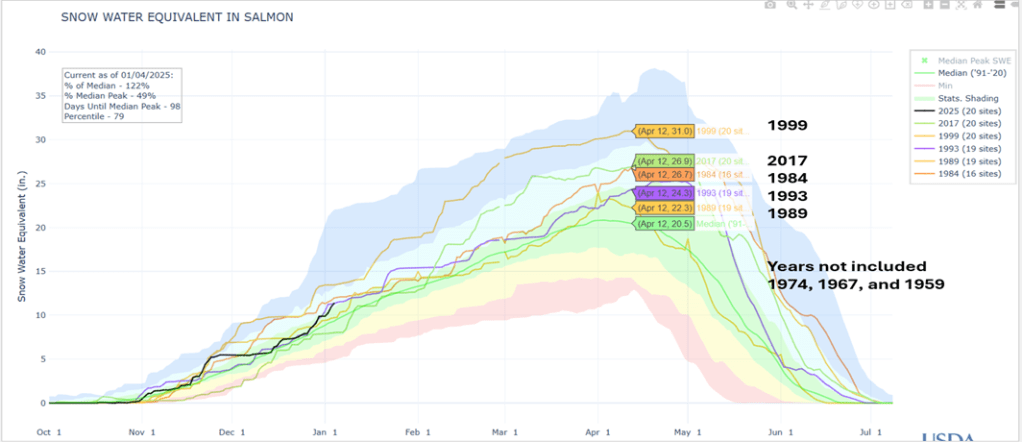
Here’s the big picture for the Salmon River. This snow index is based on about 20 SNOTEL sites. It also shows that this year, 2025, is tracking these years that follow a Strong El Nino Year.
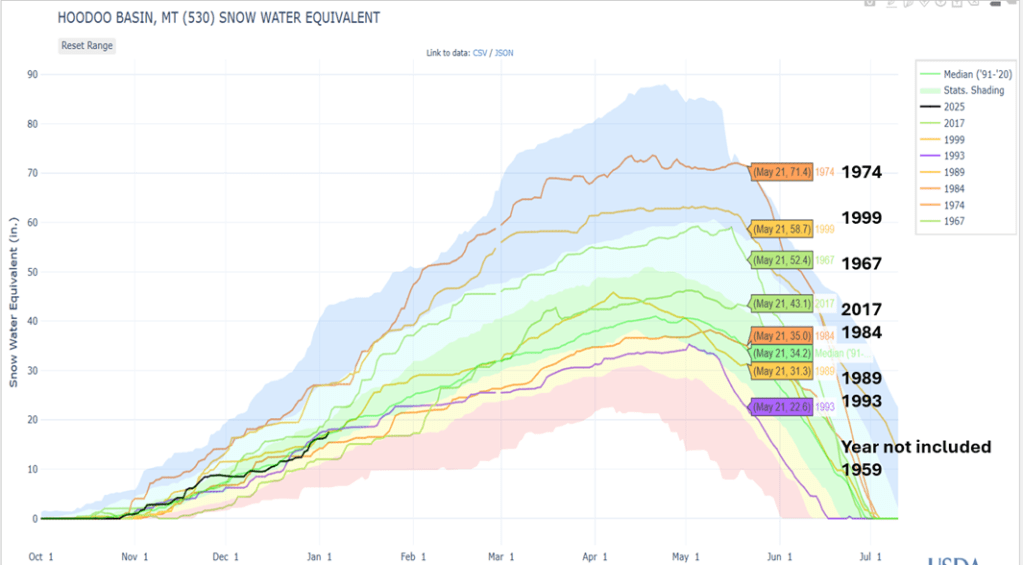
Looking at Hoodoo Basin which has daily SWE starting in 1967 also shows it was a good snow year. Interesting to note that Pete’s analog years were also 1967, 1993 and 2017 which all followed Strong El Nino Years.
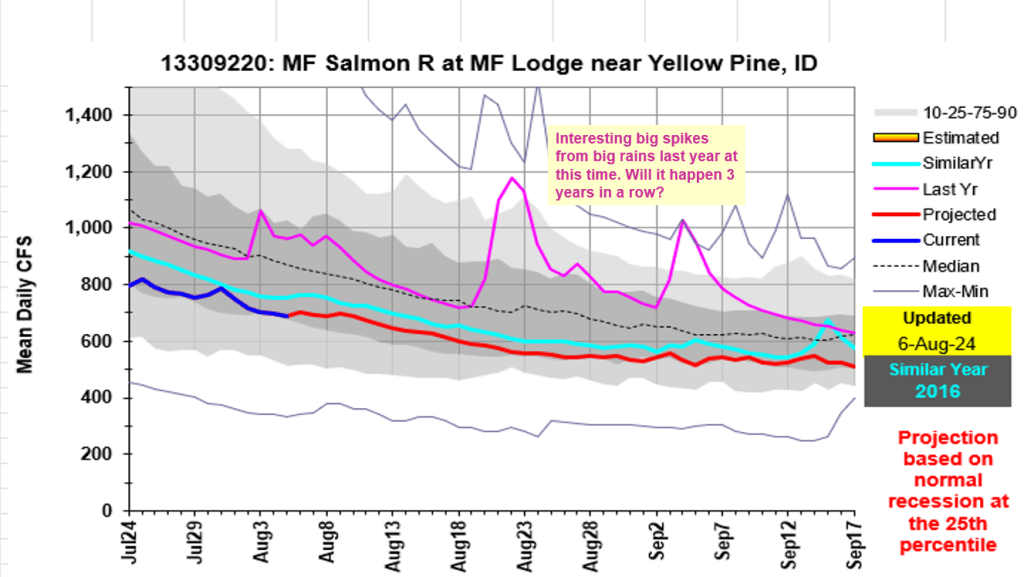
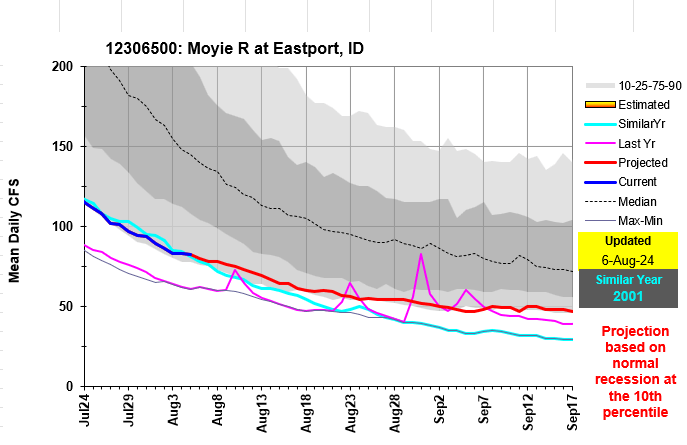
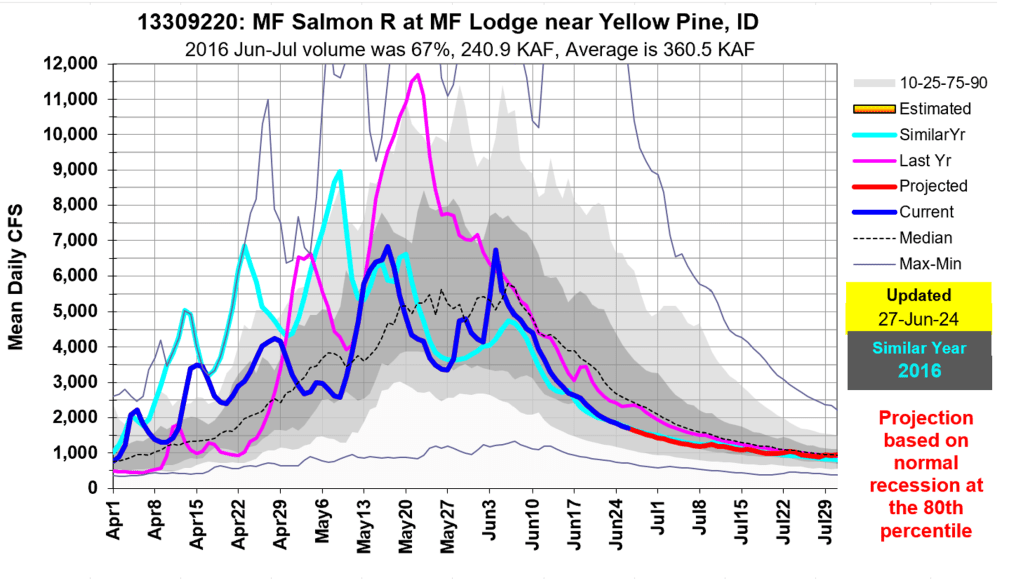
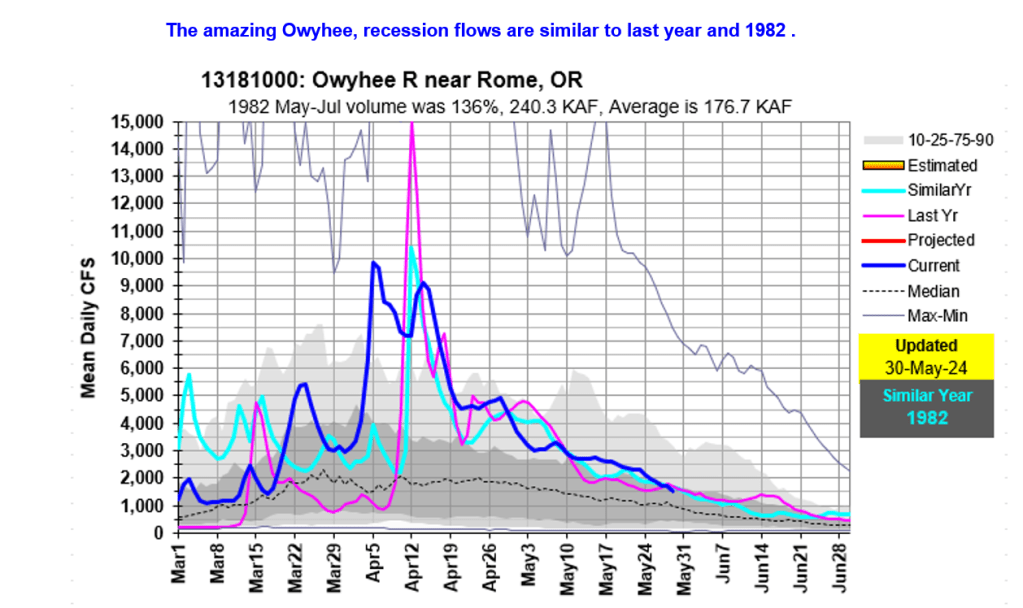
MF has leveled off flowing less than last year and similar to 2016. The headwater of the Snake River is pushing record low flows based on 40 years of data. Salmon Falls Creek is usually one of the first rivers to bottom out in late summer / early fall and the flow starts increasing with the longer, cooler nights and reduced water up take from plants.
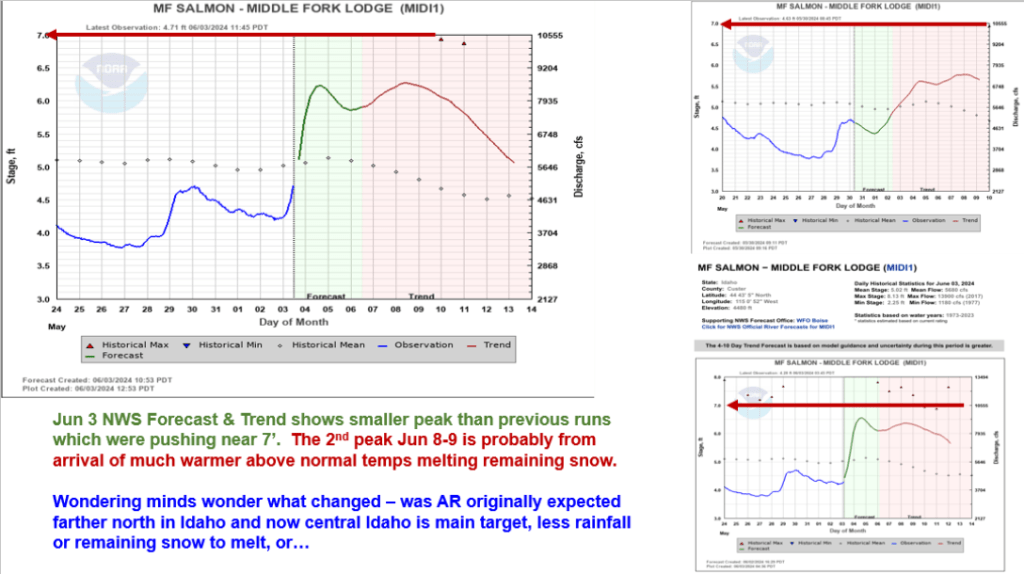
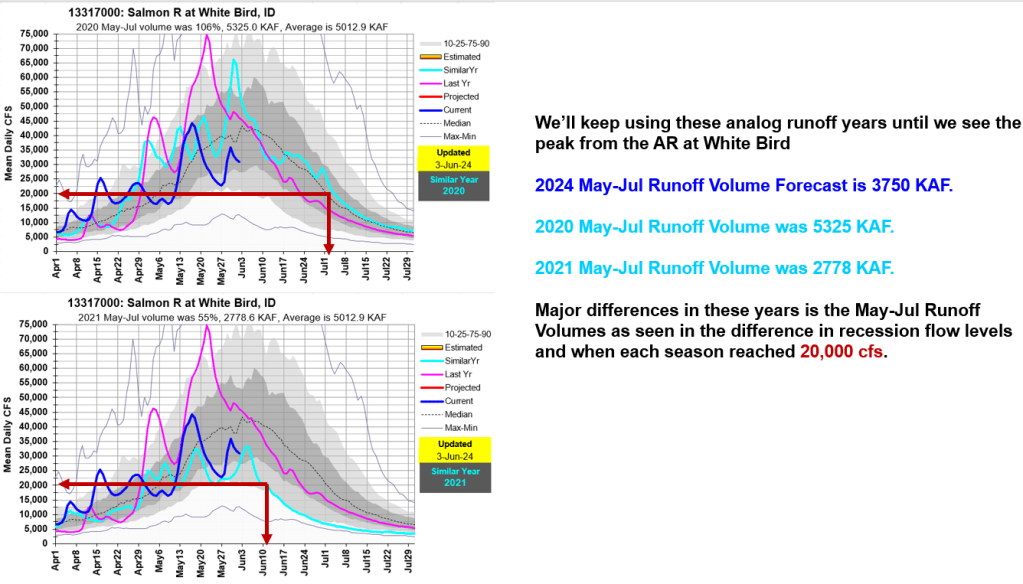
What an event it was that added much needed moisture to many Idaho rivers. Following is a statewide summary about the impacts of this early June Atmospheric River Event. This rain on snow event increased streamflow in many rivers across the state that will push recession flows out a bit.
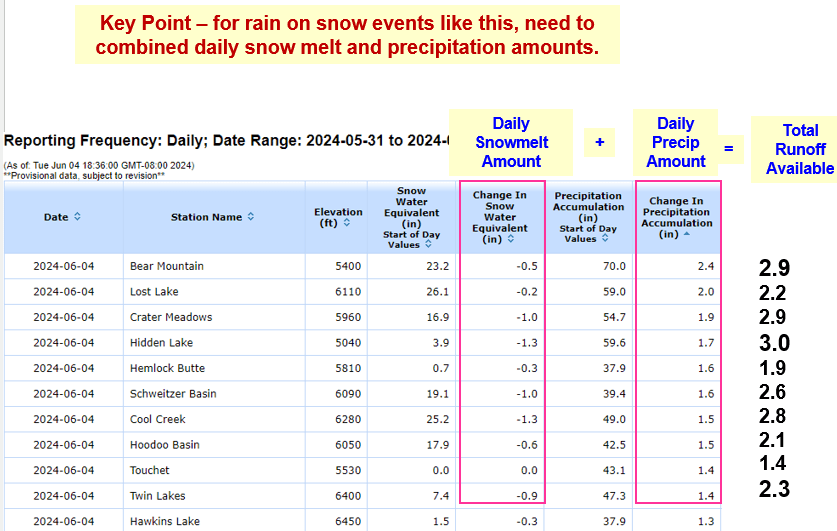
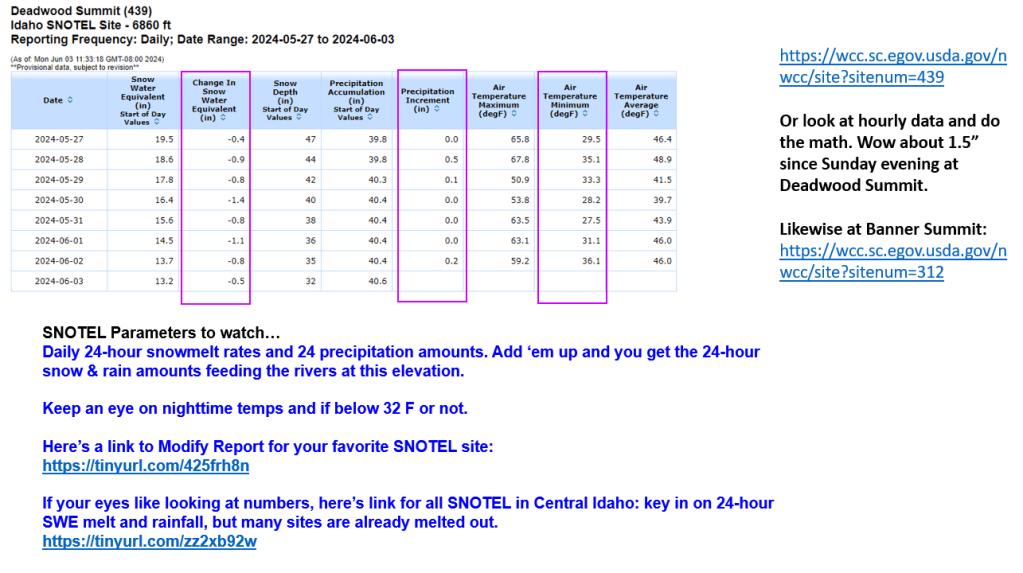
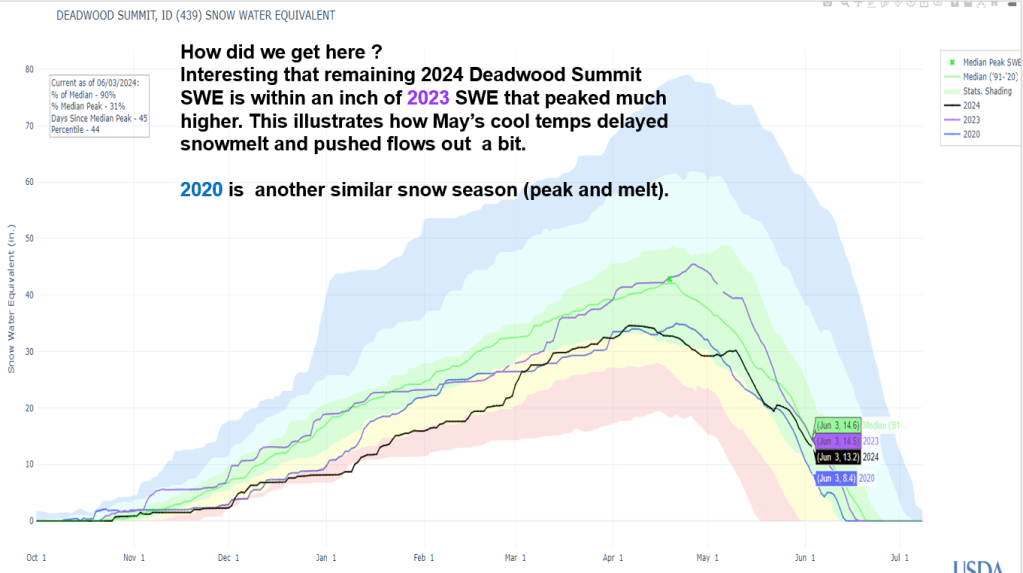
Combining daily rainfall and snowmelt resulted in 2.5 to 3.0” of Total Runoff Available at a few SNOTEL sites. The cool May temps delayed snowmelt allowing snow to remain in higher elevations that provided a runoff boost with the falling rain.
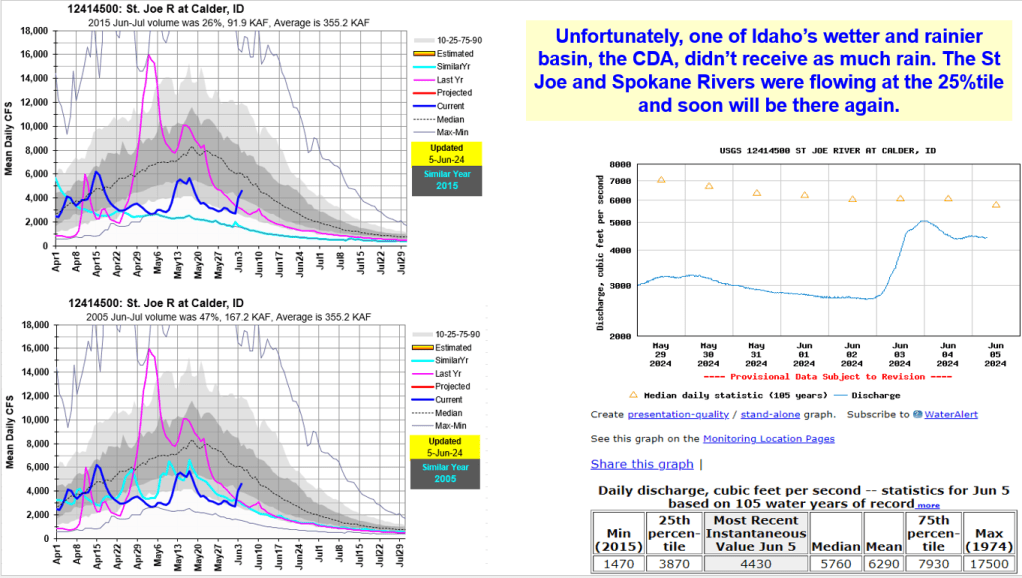
What a storm it was – who do you thank ? Those benefiting include fish, wildlife, river runners, salmon flows, hydropower production and more. The streamflow boost created another flow increase that will keep recession flows higher longer. However, some basins missed the positive impacts from this event. See the following analysis to see why some rivers benefited while others continued with their downward recession trend.
Benefits include assisting with final fill of some reservoirs, delayed irrigation water use that may even result in better reservoir carryover storage for next year. Impacts include challenges for those on rapid rising rivers especially for those adventuring on the MF Salmon River and experiencing the New Velvet Rapid up close.
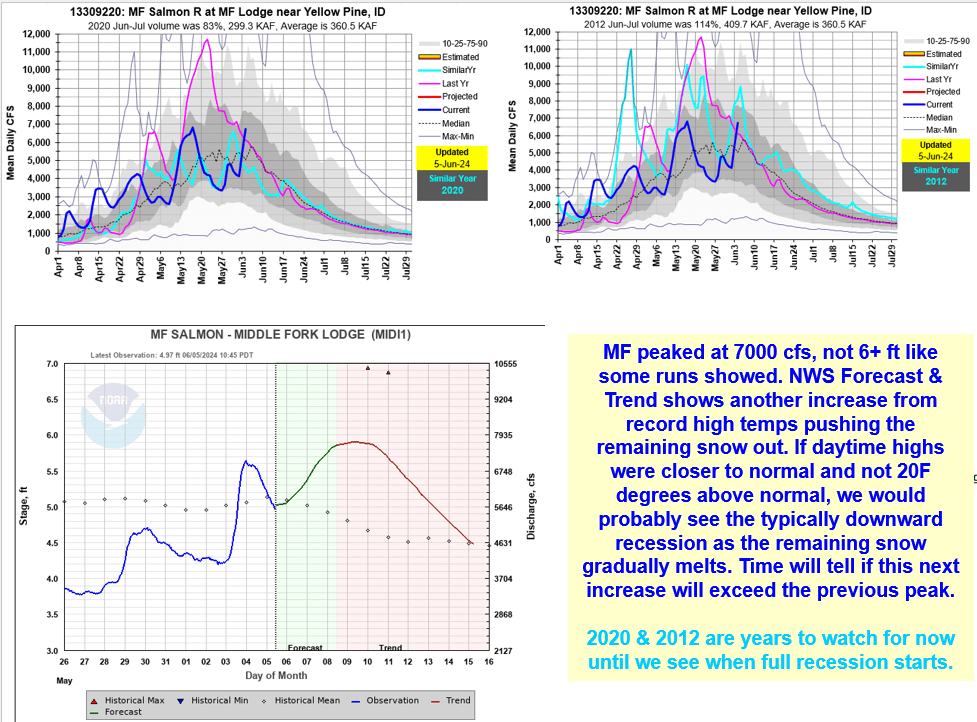
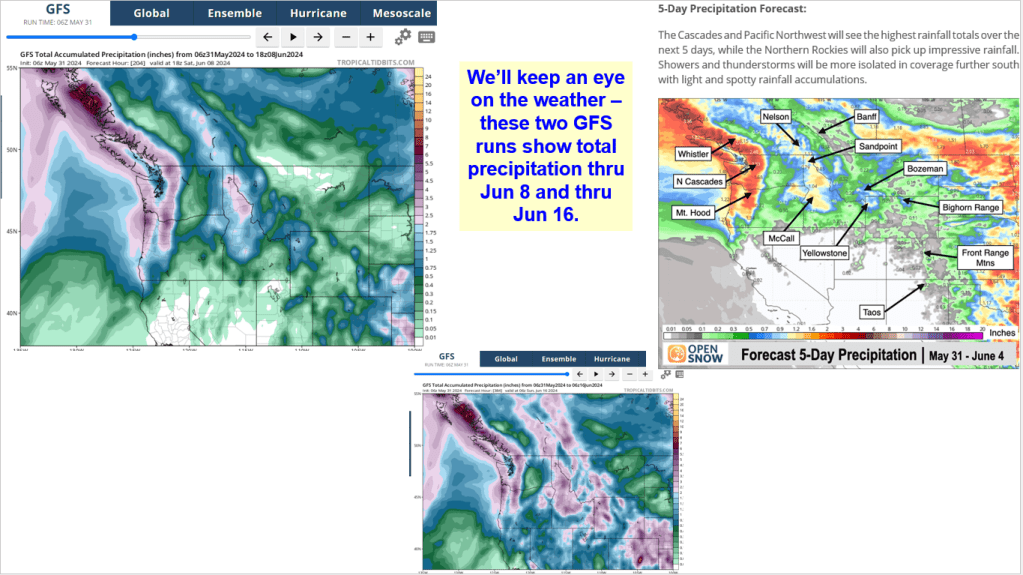
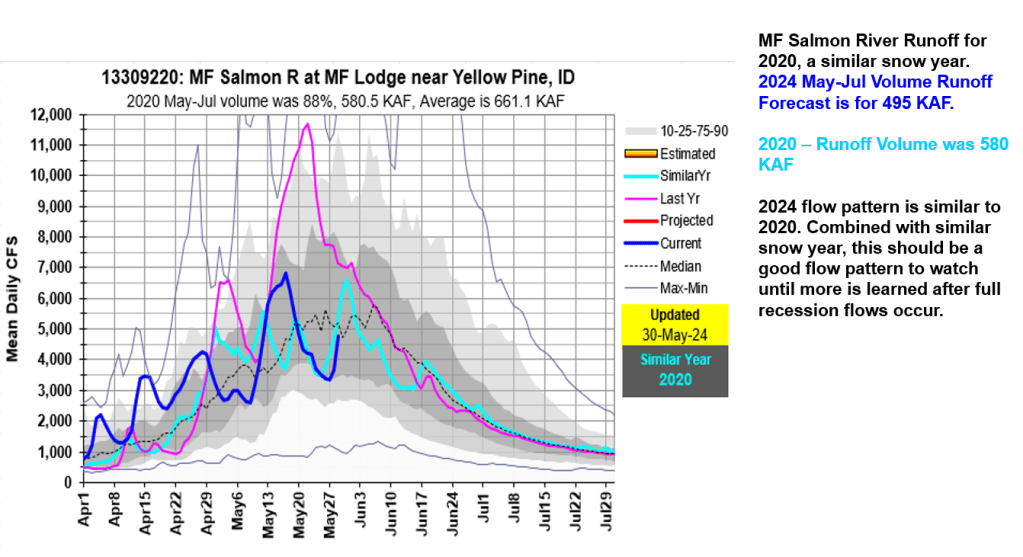
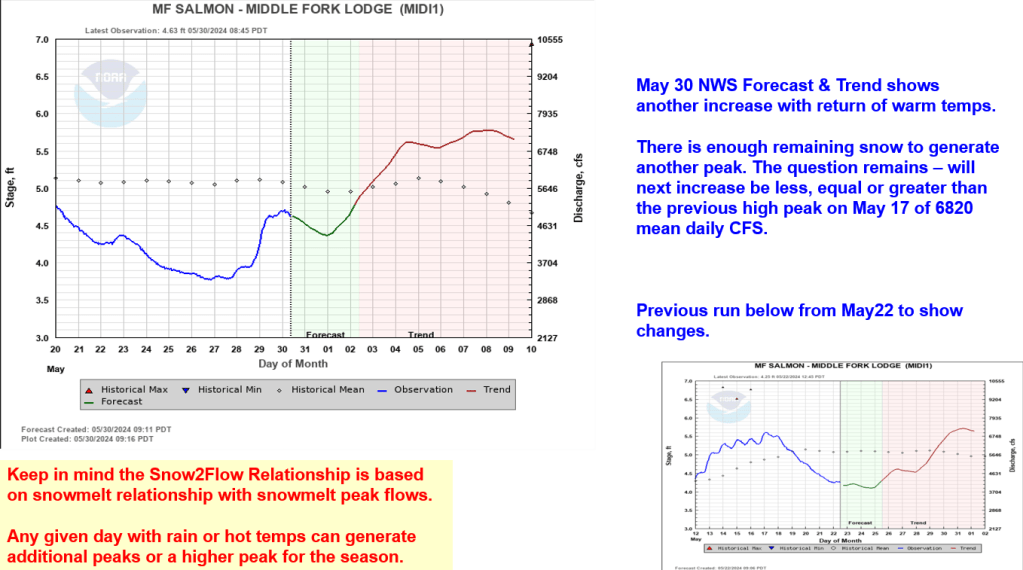
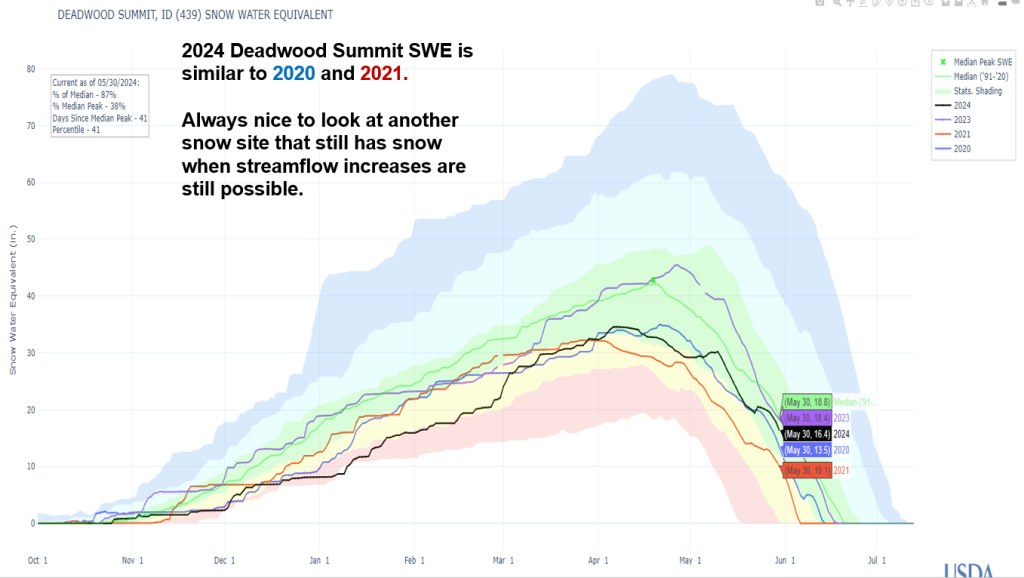
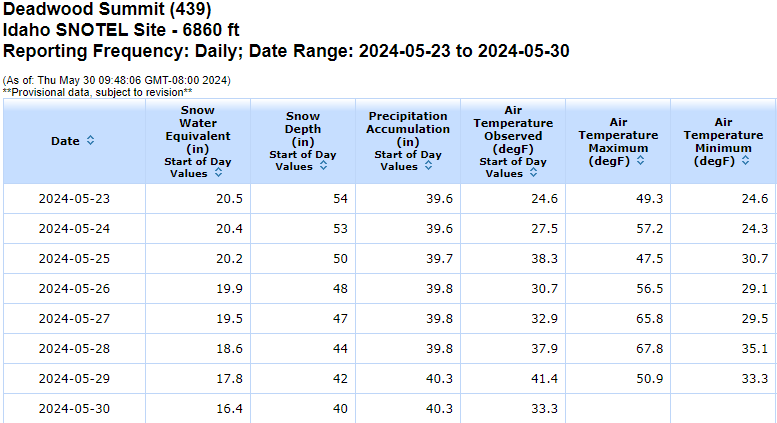
With the return of warm temps, rivers are rising again. The last cold front slowed the melt down to a few tenths per day and increased to 1.4″ yesterday with temps reaching 67 F at Deadwood Summit. With these yoyo like temps and some precipitation remaining in forecast, expect a few more ups n downs in flow levels before full recession starts.
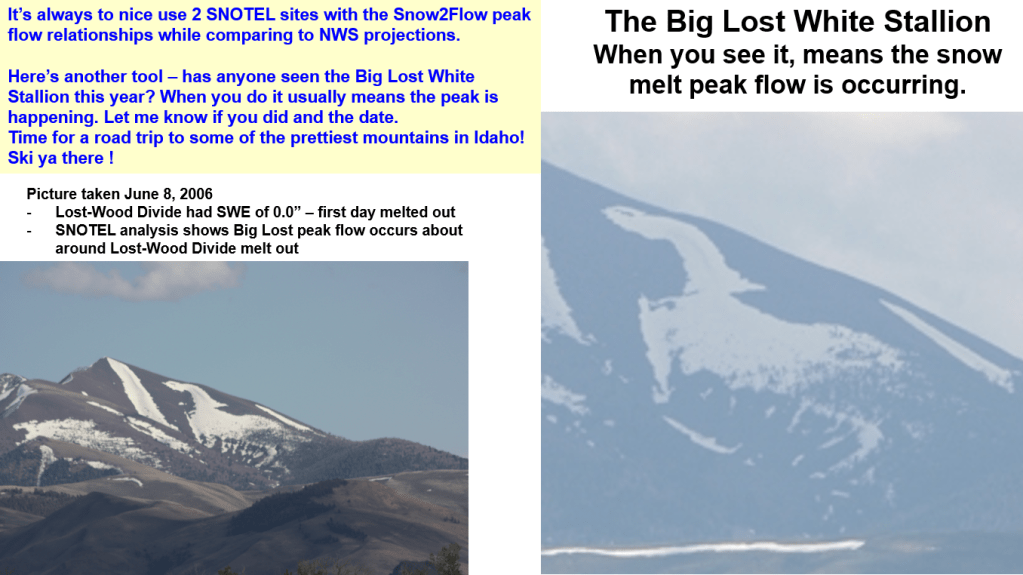
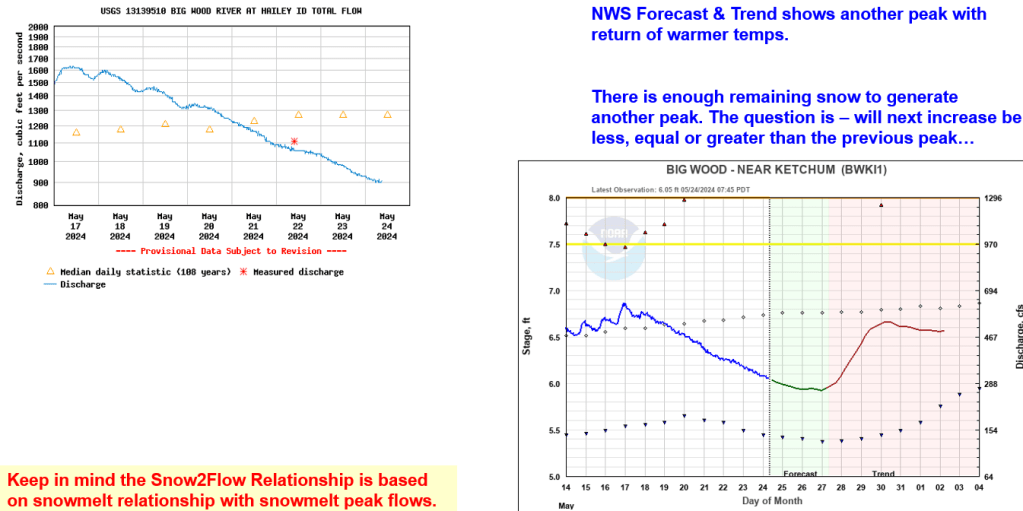
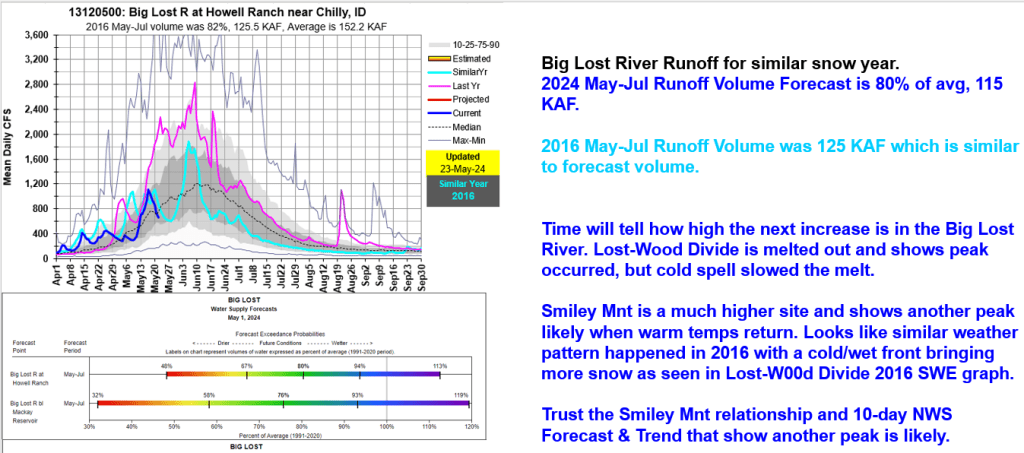
It’s always nice to see what the rivers are doing where you are going or where you want to be. The recent cold spell put a damper on snowmelt when rivers were increasing and put a twist in the Snow2Flow relationships, but there’s still enough remaining snow to generate another increase if not the peak for the season. Stay tuned, and if you happen to see the Big Lost Shite Stallion, let me know !
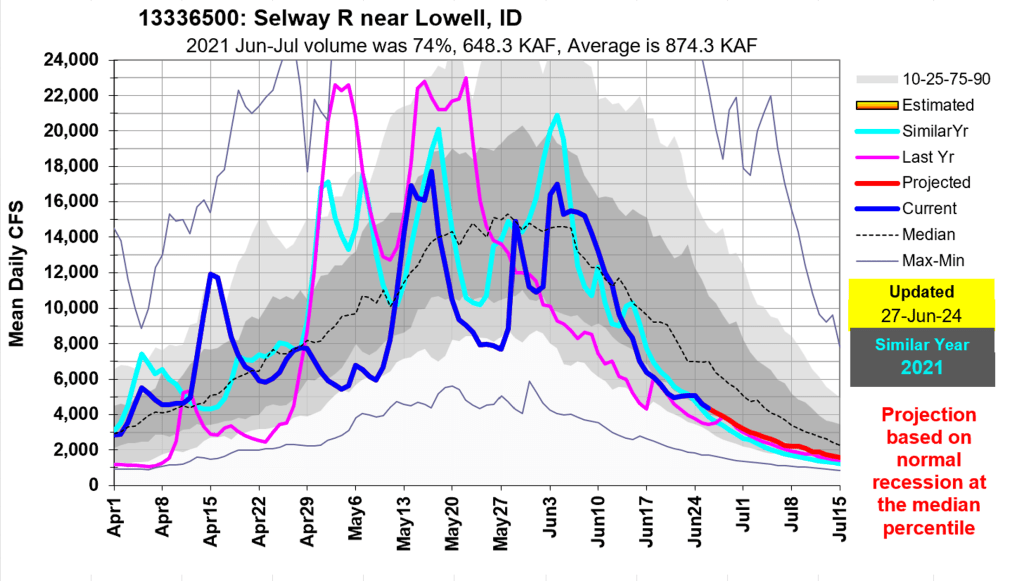
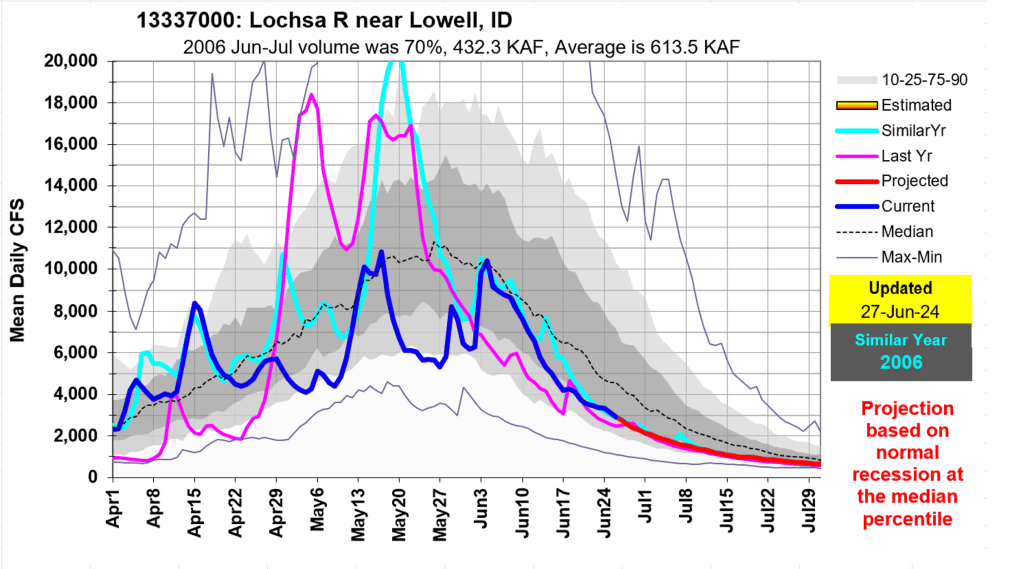
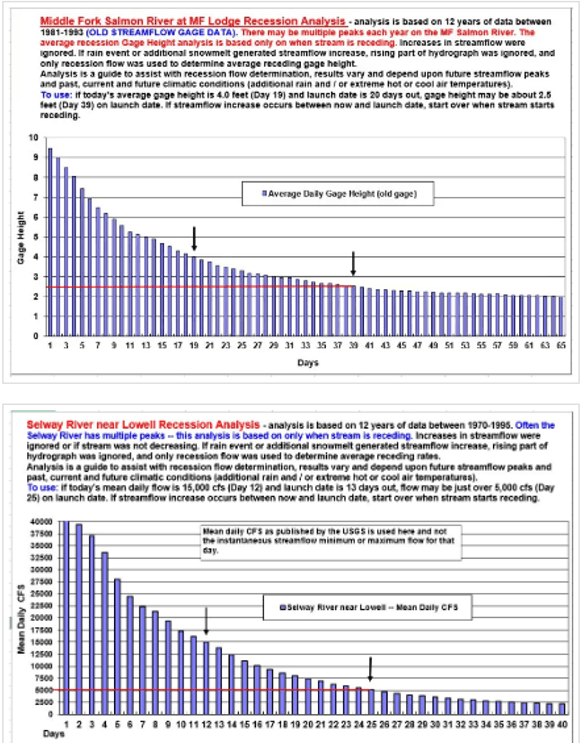
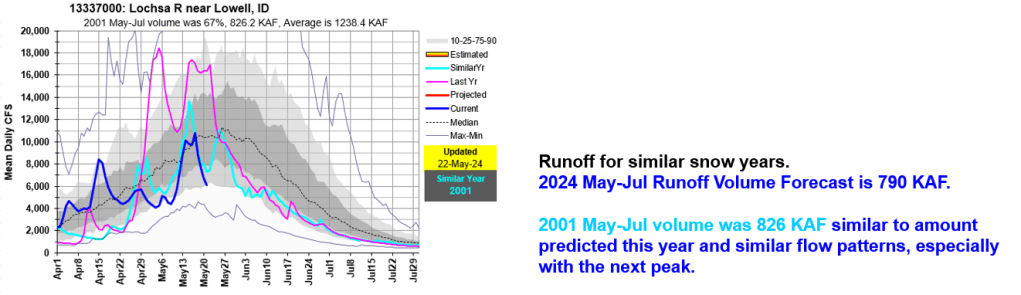
Here’s an update for the MF, Main, Lochsa and Selway Rivers showing there’s enough remaining snow to generate another increase in flow the next few days. This may be the last week of cooler/wetter spring weather with forecasts hinting at warmer/nicer weather for June’s arrival. Keep an eye on the sky watching the weather, and your mouse on snow melt and river levels pages as we see how high the rivers rise from this pulse of water coming out of the mountains. Enjoy & be safe !