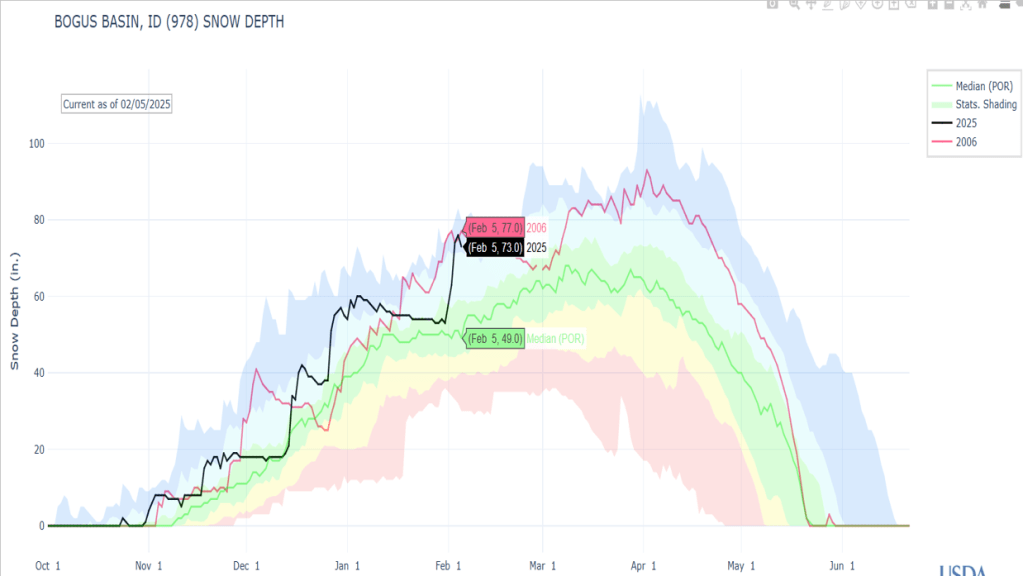
Here’s a snow depth summary for sites around your favorite ski areas. More storms on the way this week, 17, 19 and potentially around March 1.

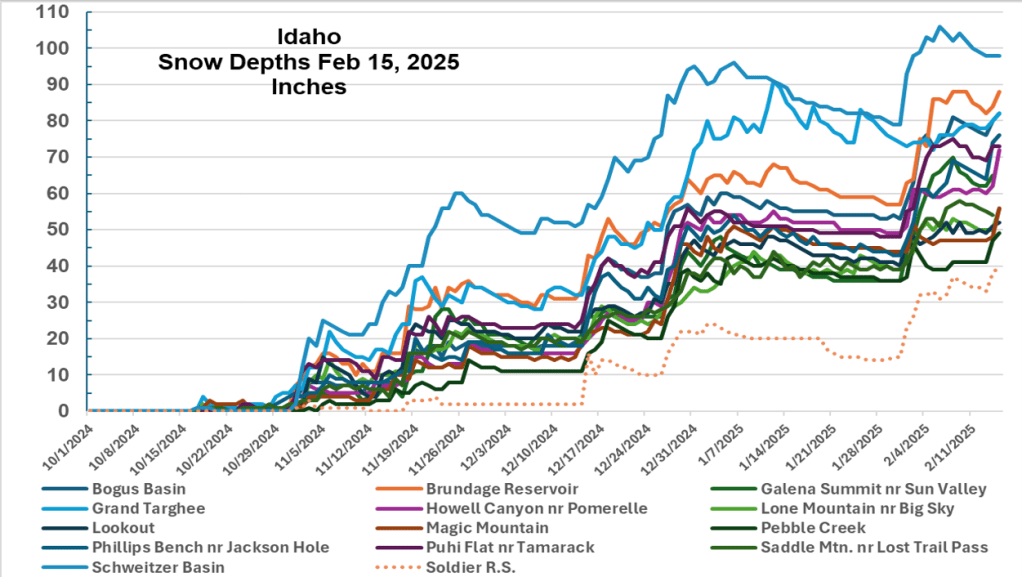
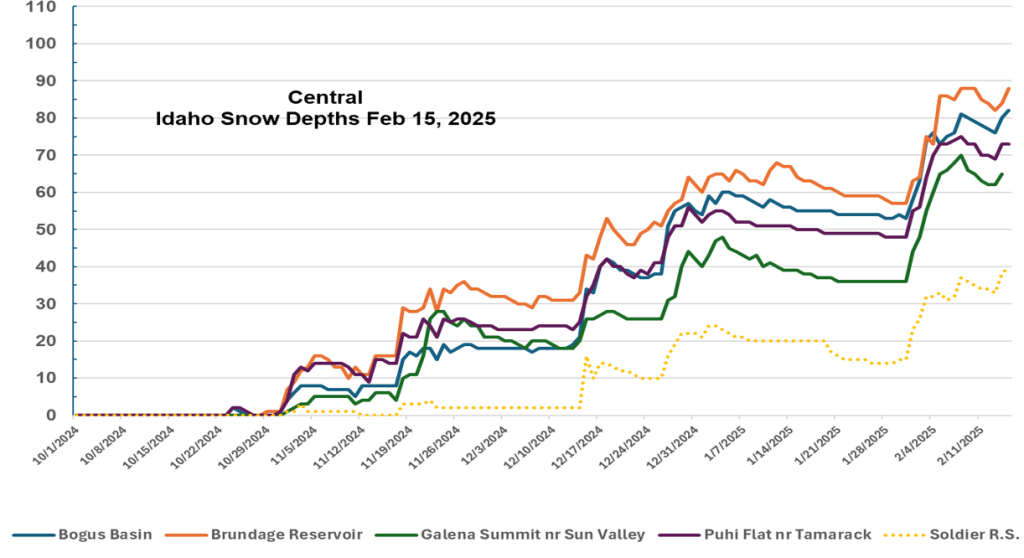
Here’s a snow depth summary for sites around your favorite ski areas. More storms on the way this week, 17, 19 and potentially around March 1.
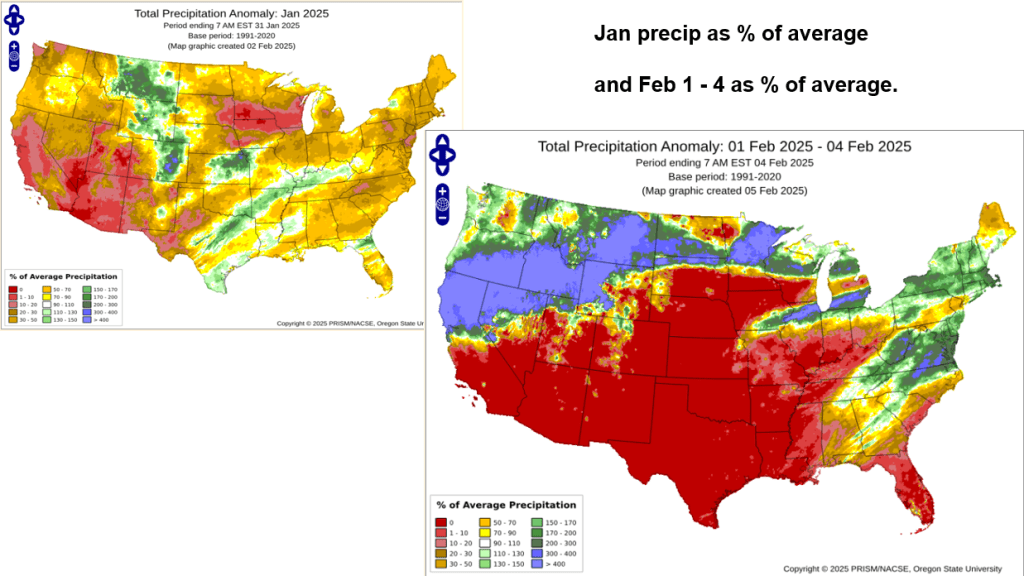
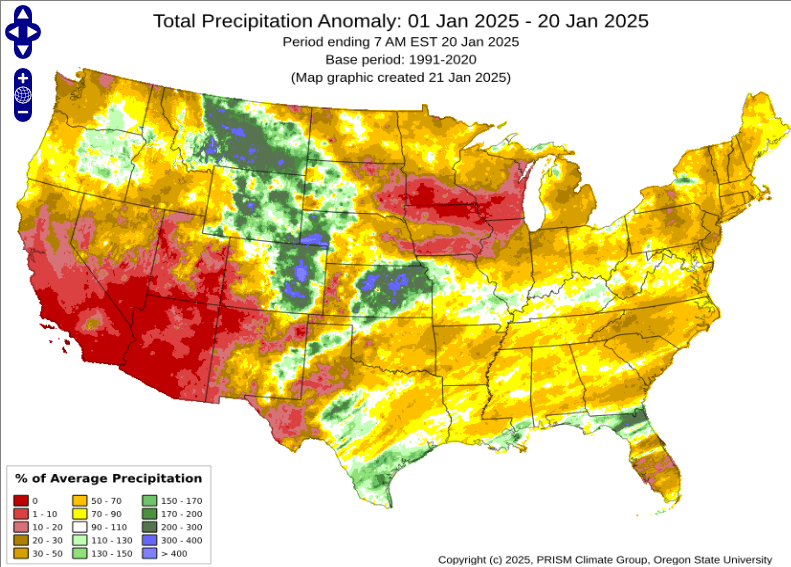
Here is quick update of CPC’s short and longer-term Outlooks for February with all Outlooks favoring cool & wet for PNW. Jan and Feb 1-4 precipitation summary, and snow depths graphs across the state are included. Enjoy and be safe. Winter is back on.


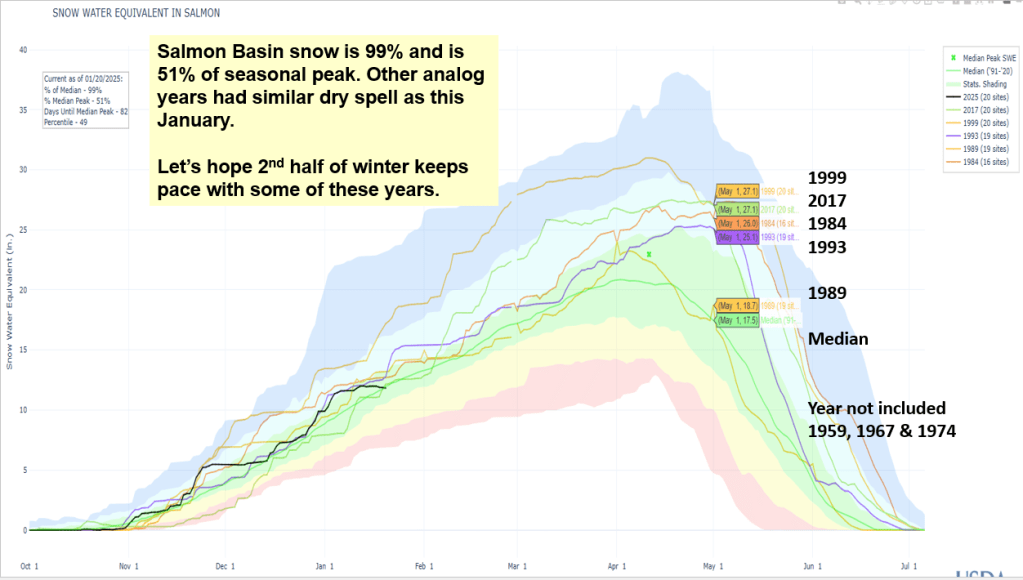
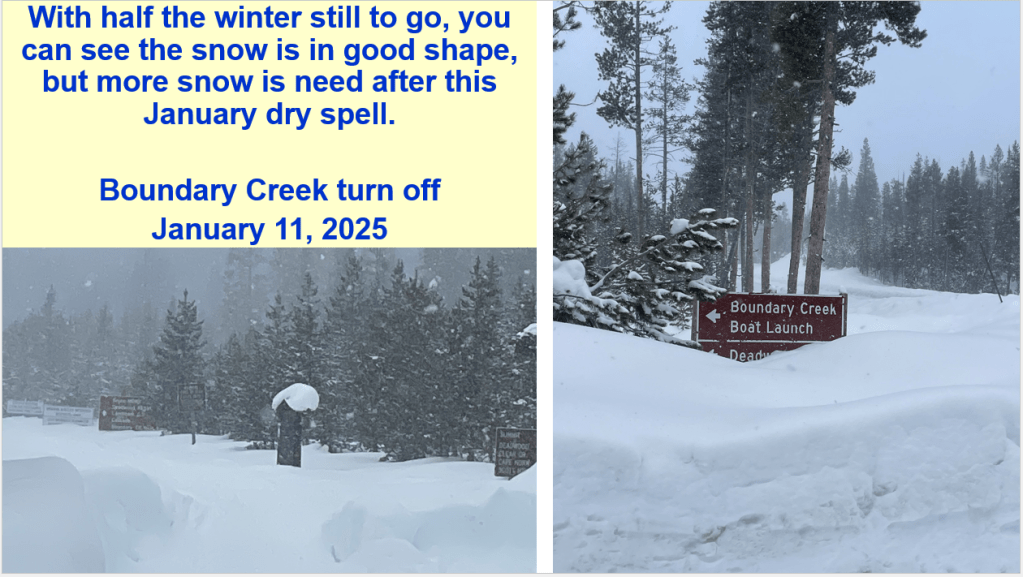
Here’s a snow & flow update for the Salmon, MF and Selway rivers and a Lochsa Bonus. Current snow conditions are displayed with analog years mentioned in previous posts. Streamflow forecast are from the NWS around Jan 20 and compared to observed runoff the analog years. January 15 is consider the half way point for winter. Overall the snow is in good shape because of the great start, but more snow is need after this dry January as show in image below.

Here’s a talk given to Idaho Alfalfa & Clover Seed Growers about current conditions, analog years, acres burned, a few slides about 2024 extreme weather and disasters, and the snow & flow outlooks for the Weiser, Payette, Boise and Owyhee basins. With high, dry and cold weather here for a bit, we’re gonna loose about 1% a day, but the snow won’t be melting. Cold is good! We’ve seen winter dry spells in other years and lucky for us, SW Idaho got off to a great start this winter. Let the 2nd half of winter start – any day now…


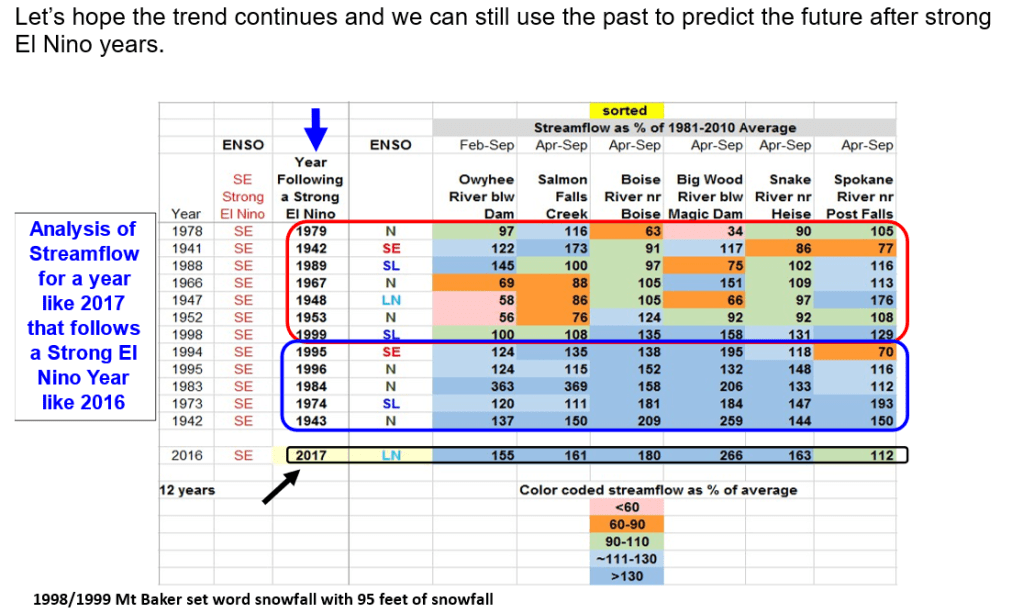
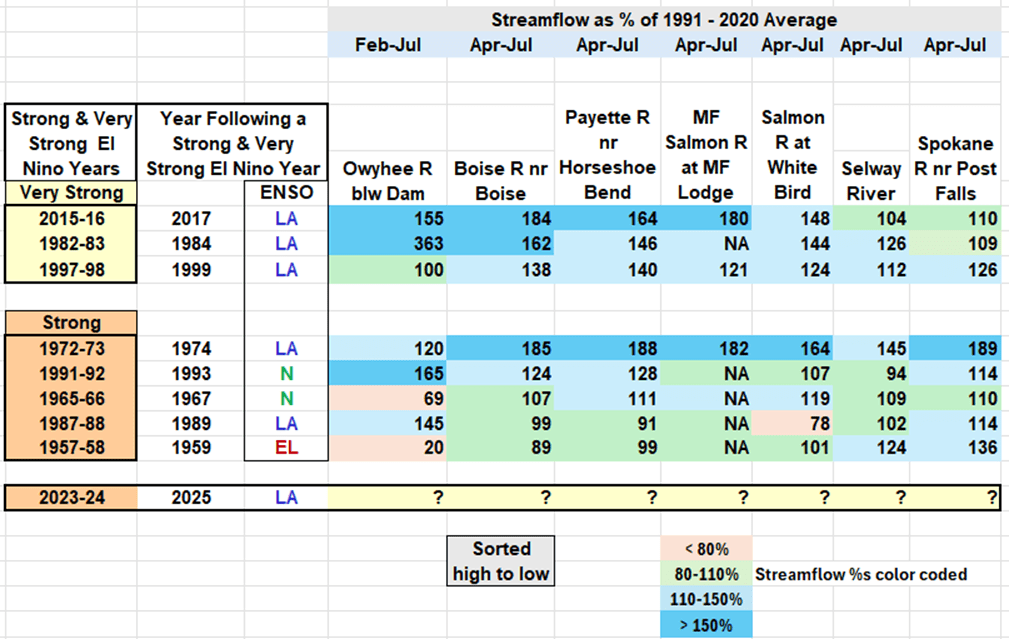
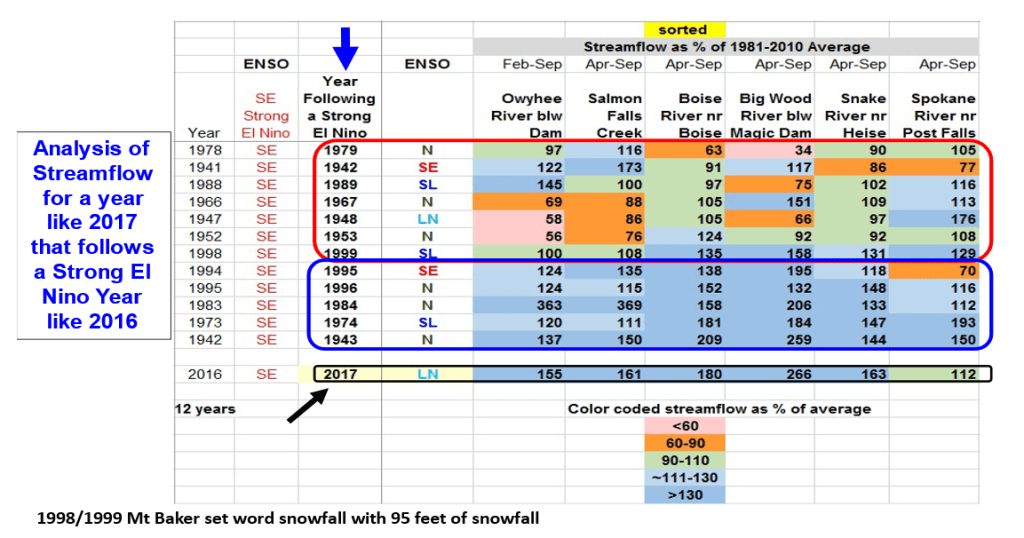
With more snow accumulating in our mountains, let’s look at how this year compares with other years that follow Strong El Nino Years. In the past, we’ve had some good snow and flow years following Strong El Nino Years. The easiest way to explain this is – it seems the oceans and atmosphere has a lot of energy to get rid of the following year. Let’s see if we can still use the past to predict the future and how the snow is tracking.
Here’s our new table of Strong and Very Strong El Nino Years and the years that follow. You can quickly see by the color shading that only a few are below 80% of average, and rest are near average, above average or outstanding with greater than 150% of average runoff.
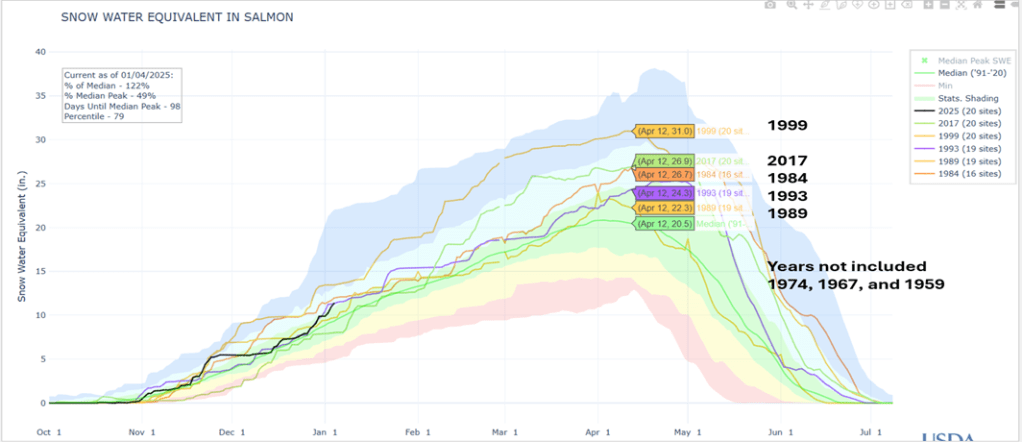
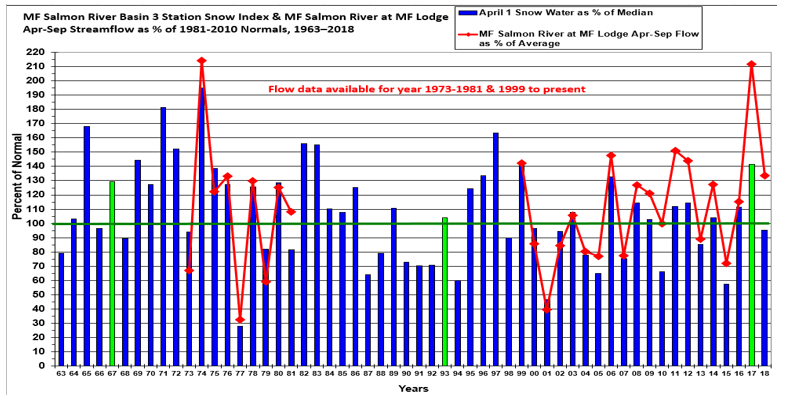
Here’s the big picture for the Salmon River. This snow index is based on about 20 SNOTEL sites. It also shows that this year, 2025, is tracking these years that follow a Strong El Nino Year.
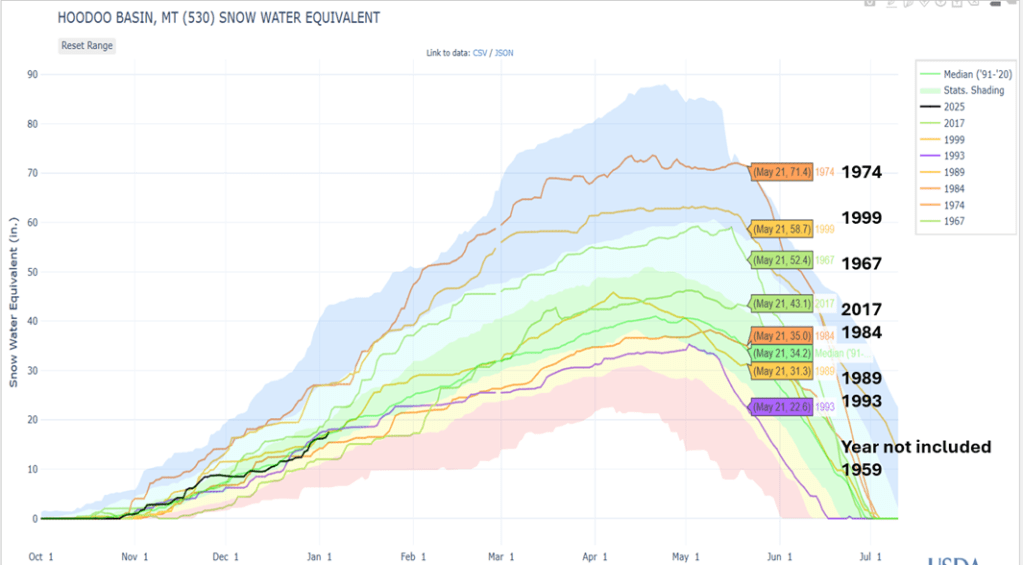
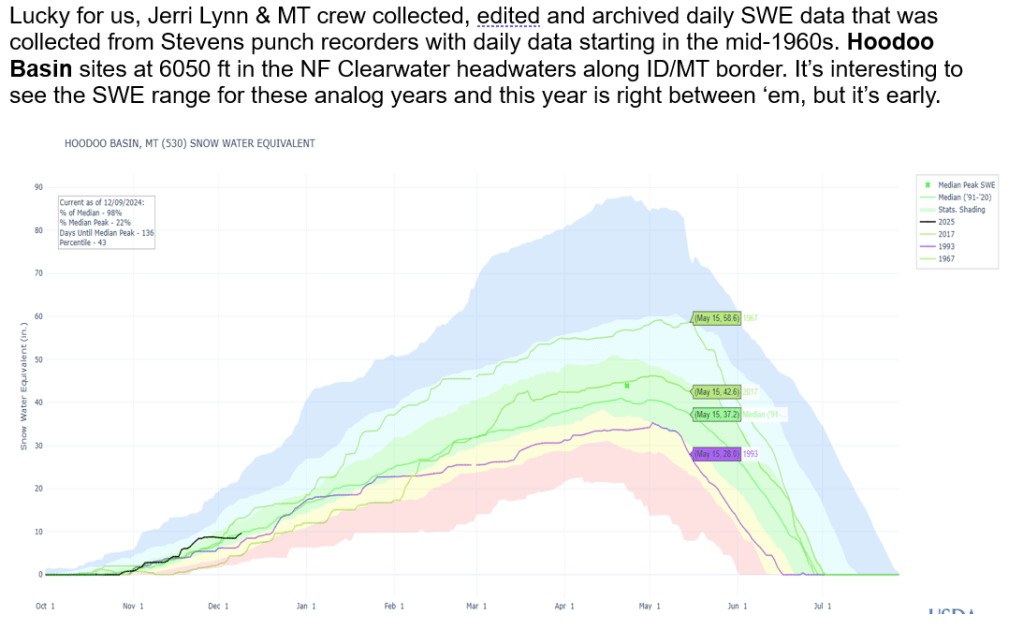
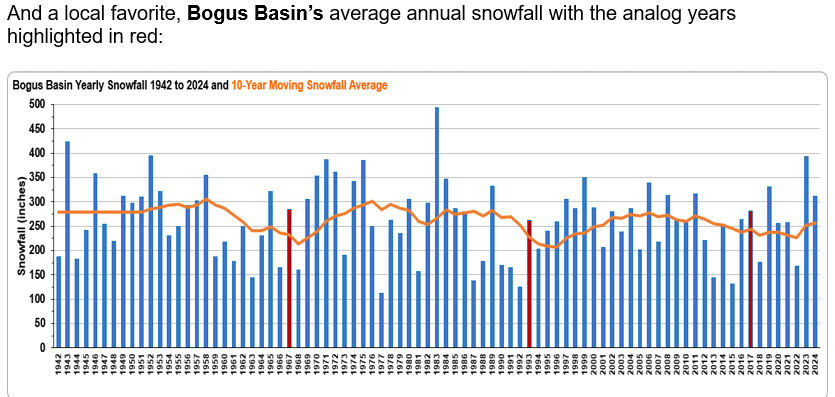
Looking at Hoodoo Basin which has daily SWE starting in 1967 also shows it was a good snow year. Interesting to note that Pete’s analog years were also 1967, 1993 and 2017 which all followed Strong El Nino Years.
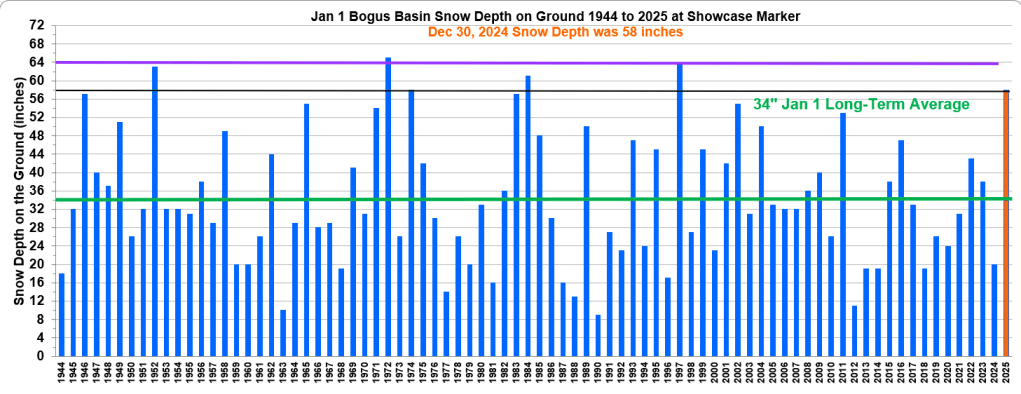
Updated graph Jan 2 with Dec 30 Snow Depth measurement value of 58” for the long-term snow course at the Showcase Marker. This winter is off to the best start since 2011 and in the top 5 highest years since daily snow depth measurements start in 2000.
Compared to historic Jan 1 data, that starts in 1944, this year is tied for 5th for the most snow on the ground for the Jan 1 snow survey. Other high years were 1997, 1984, 1972,and 1952.
Storms are still expected but smaller in size compared to recent ones. Winter like temps finally arrive as cold temps dip into mid-West in mid-Jan.
Lots going on with the Polar Vortex stretching and pulling, and lots to learn about Greenland’s weather impacts on our weather. We know we are in for a colder ride between now and mid-Jan, especially in the Mid-west. Here are Judah’s thoughts for the 3rd week of Jan. Stay tuned as lots gong on 3rd week of Jan along with my birthday !
“So, during the third week of January this will result in a transition to milder weather in both Europe and the Eastern US with cold weather becoming more entrenched in the Western US. But it also appears Siberia will turn colder at this time, so I don’t think winter weather in the Eastern US is done just yet like last winter.” http://www.judahcohen.org/
Now with snow starting to accumulate in the mountains, let’s look at the start of this winter’s snowpack and compare it to the analog years we’ve been talking about. Here’s a recap of Pete Parsons, Oregon Dept of Ag, Seasonal Climate Forecast from November 21, 2024 Update.
Let’s have some fun and look at how this year’s snowpack is starting to accumulate and compare with the analog years 1967, 1993 and 2017. We’ll look for similar snow accumulations patterns and as we progress deeper into winter, we’ll see if one year stands out more than the others and use it to provide some insight about next summer’s river flows.
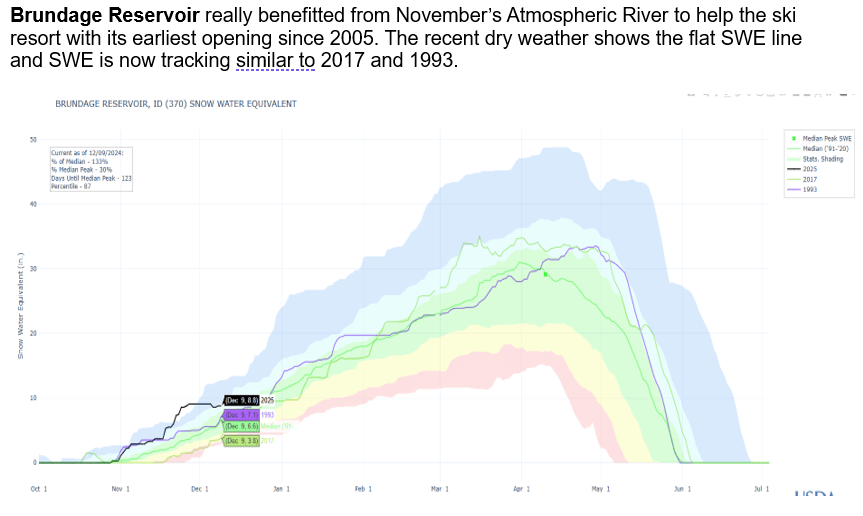
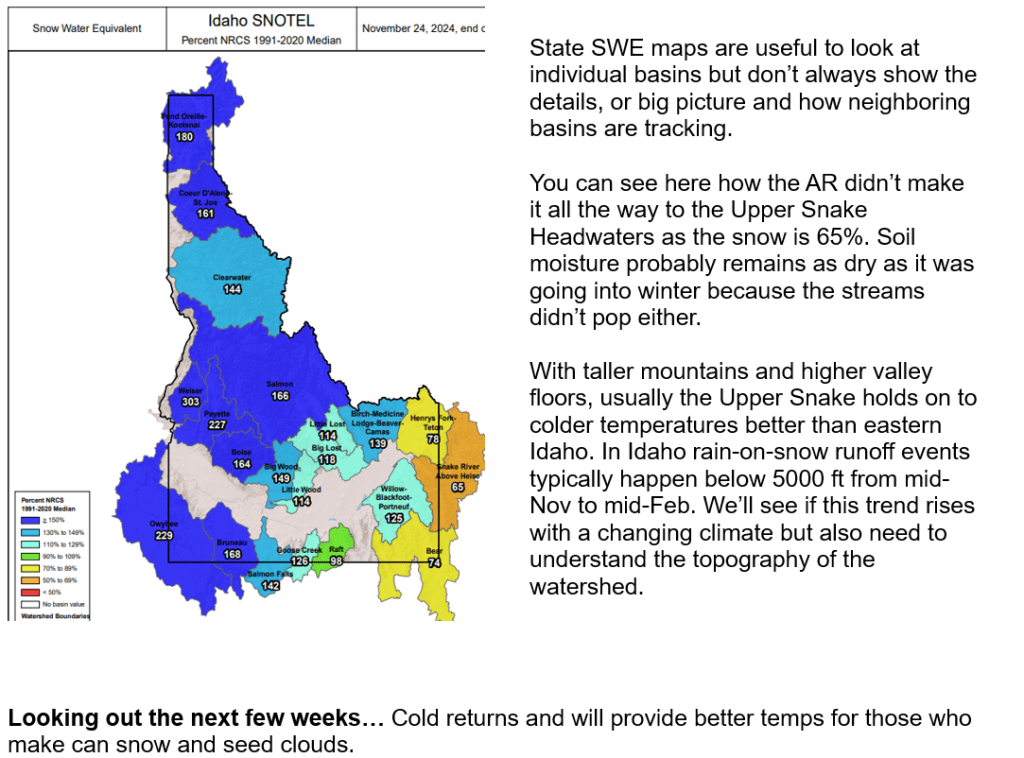
With hurricane strength winds, very low pressure, 20+ inches of precipitation, and snowfall measured in feet, you can call it what you want, bomb cycle, typhoon, hurricane, but the Category 4 Atmospheric River (AR), is just want we needed. Let’s look at the big picture – the hydro conditions before the storm and where we are now that the stage is set, and dinner is being served.
Strong or weak La Nina, it doesn’t really matter for years following a strong El Nino like last year. Years that follow seem to have a lot of energy to release, as mentioned in last post. Keep in mind, the key Pacific months to watch that correlate with our winter snowfall and spring/summer streamflow are July-November, and we have only seen the data thus far through September for this year.
Here’s a few examples to watch as winter moves in to set the Dinner Table. Nothing can be guaranteed but with wild weather around us, there is no reason not to expect the extreme and wild weather to continue. We are not living in the calm and quiet doldrum years like the early 2000s.
Following are highlights:
Current neutral ENSO conditions are predicted to change into La Nina conditions for this winter. Weak or strong La Nina? It doesn’t really matter in years following a strong El Nino like last year.
Following is a summary of the different outlooks, explanation of current conditions, and reading material if you can’t sleep or just interested in learning about these relationships. You can skip to the end for the summary to see what happens in winters following strong El Ninos or here it is…