Now with snow starting to accumulate in the mountains, let’s look at the start of this winter’s snowpack and compare it to the analog years we’ve been talking about. Here’s a recap of Pete Parsons, Oregon Dept of Ag, Seasonal Climate Forecast from November 21, 2024 Update.
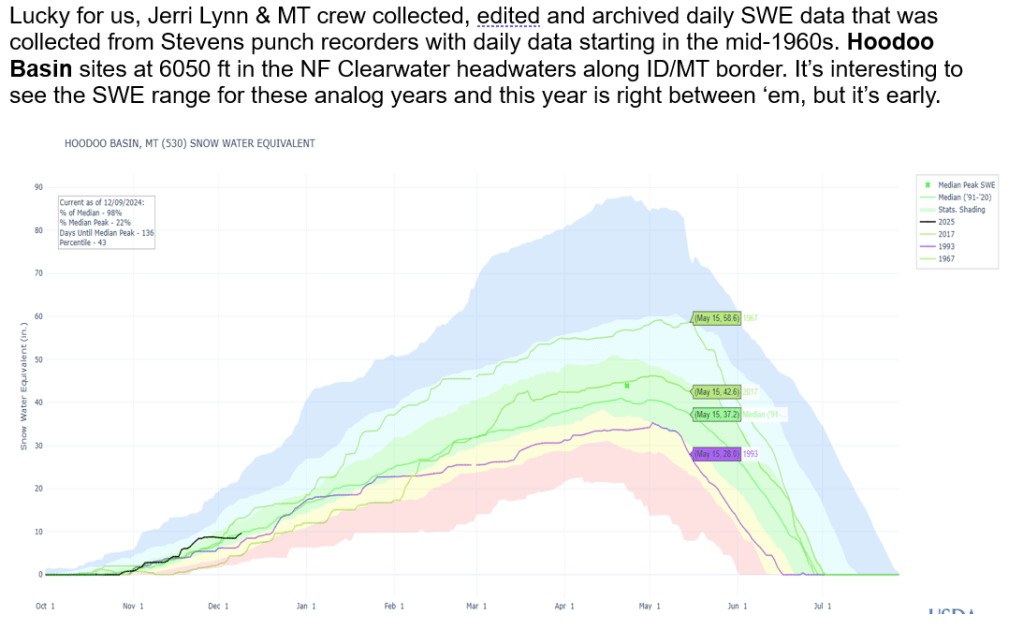
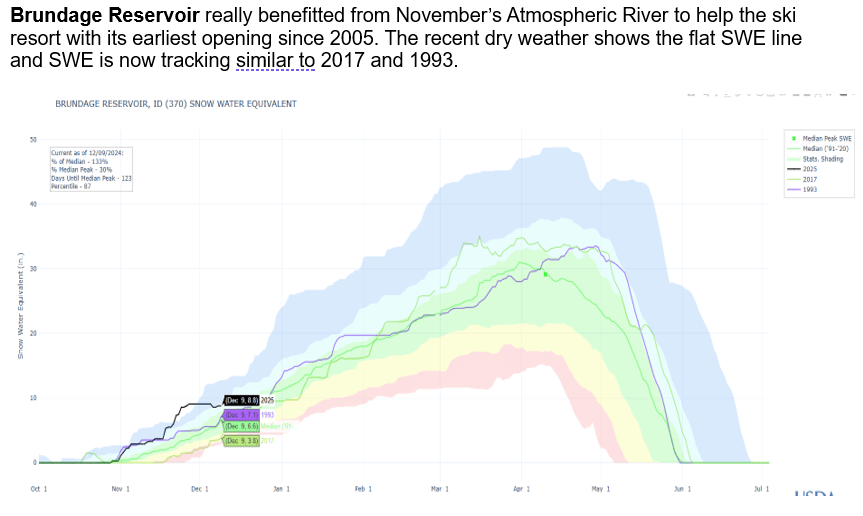
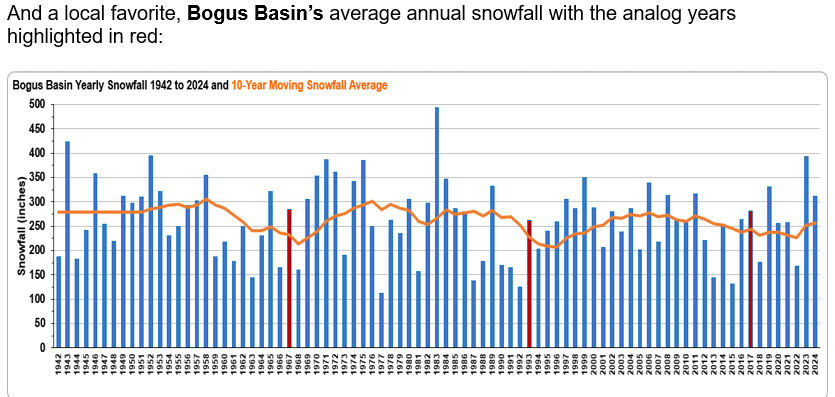
Let’s have some fun and look at how this year’s snowpack is starting to accumulate and compare with the analog years 1967, 1993 and 2017. We’ll look for similar snow accumulations patterns and as we progress deeper into winter, we’ll see if one year stands out more than the others and use it to provide some insight about next summer’s river flows.
With hurricane strength winds, very low pressure, 20+ inches of precipitation, and snowfall measured in feet, you can call it what you want, bomb cycle, typhoon, hurricane, but the Category 4 Atmospheric River (AR), is just want we needed. Let’s look at the big picture – the hydro conditions before the storm and where we are now that the stage is set, and dinner is being served.
Strong or weak La Nina, it doesn’t really matter for years following a strong El Nino like last year. Years that follow seem to have a lot of energy to release, as mentioned in last post. Keep in mind, the key Pacific months to watch that correlate with our winter snowfall and spring/summer streamflow are July-November, and we have only seen the data thus far through September for this year.
Here’s a few examples to watch as winter moves in to set the Dinner Table. Nothing can be guaranteed but with wild weather around us, there is no reason not to expect the extreme and wild weather to continue. We are not living in the calm and quiet doldrum years like the early 2000s.
Following are highlights:
NOAA’s mid-September Prediction shows the likelihood of a weak or mild La Nina and one outlier favoring the strong.
Usually, we don’t start looking or talking about the Siberian snow cover until November, but it’s off to a great start!
Another source to explain the Siberian Snow Cover relationship is from Severe Weather Europe, if you can read between the ads.
Now let’s look at Pete Parson Oct 17, 2024, analog years update for this season.
1967 – doesn’t stand out as it was a near normal year in central Idaho.
1993 – a near normal year sandwiched between two drought years, 1992 & 1994, that was influenced by the 1991 Mt Pinatubo eruption.
2017 – a huge winter with 45 Atmospheric Rivers hitting the West coast.
Current neutral ENSO conditions are predicted to change into La Nina conditions for this winter. Weak or strong La Nina? It doesn’t really matter in years following a strong El Nino like last year.
Following is a summary of the different outlooks, explanation of current conditions, and reading material if you can’t sleep or just interested in learning about these relationships. You can skip to the end for the summary to see what happens in winters following strong El Ninos or here it is…
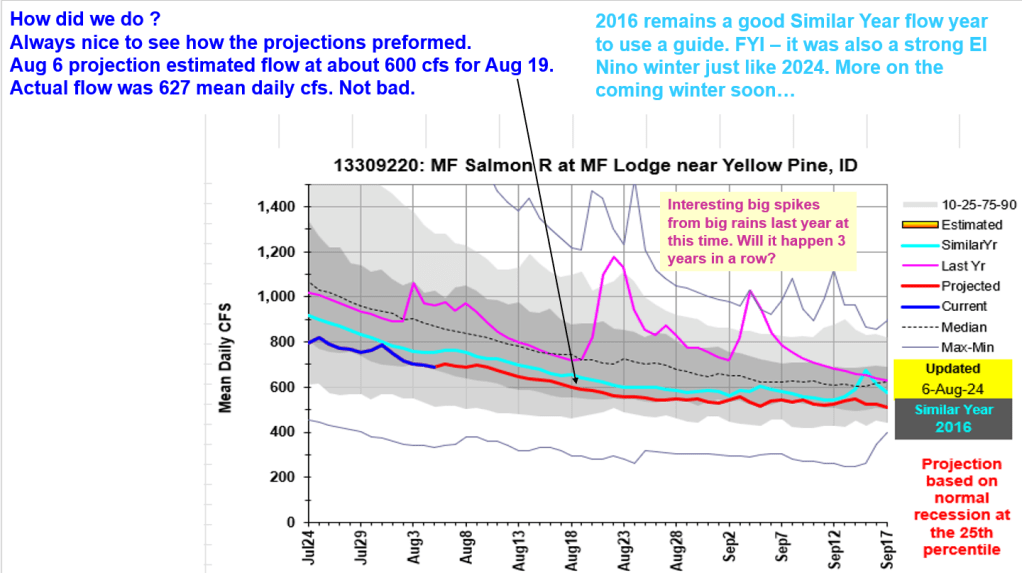
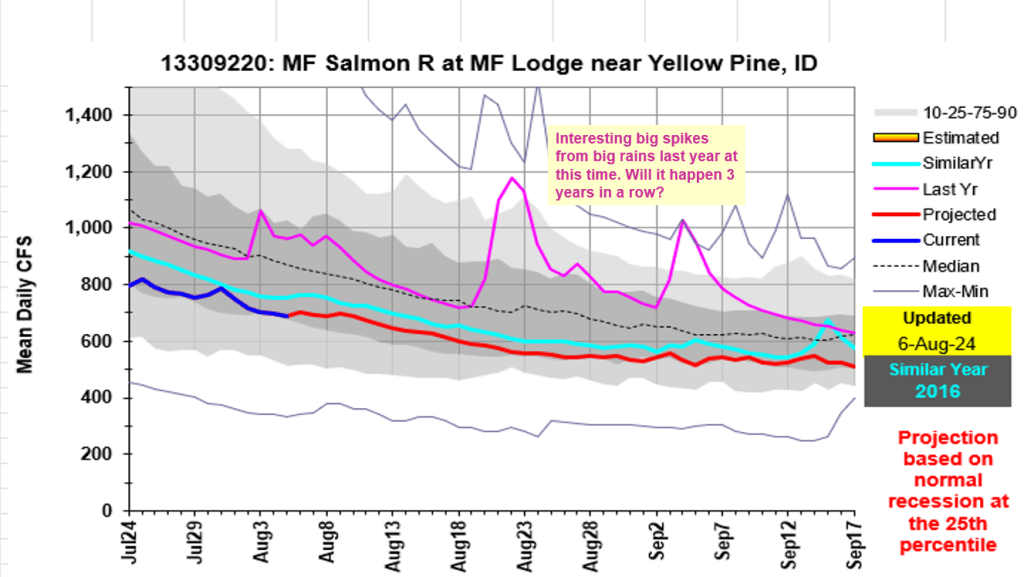
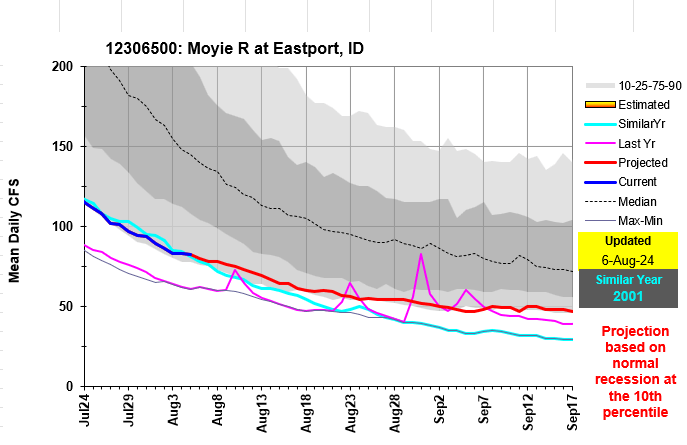
With some moisture moving in this weekend, we’ll soon see which rivers benefit from the moisture and which basins the moisture helps to slow the fires progress. This update has a few weather outlooks, and projected flow graphs along with comparisons to see how the Aug 6 flow projections preformed. Projections were pretty good. Rivers are easier to project when they are approaching their seasonal lows for the year.
MF has leveled off flowing less than last year and similar to 2016. The headwater of the Snake River is pushing record low flows based on 40 years of data. Salmon Falls Creek is usually one of the first rivers to bottom out in late summer / early fall and the flow starts increasing with the longer, cooler nights and reduced water up take from plants.
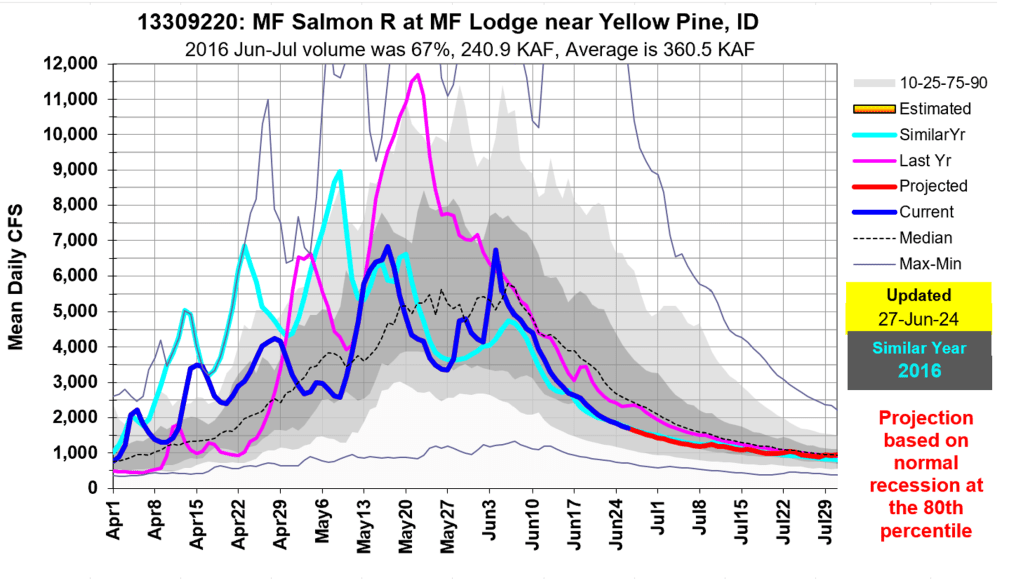
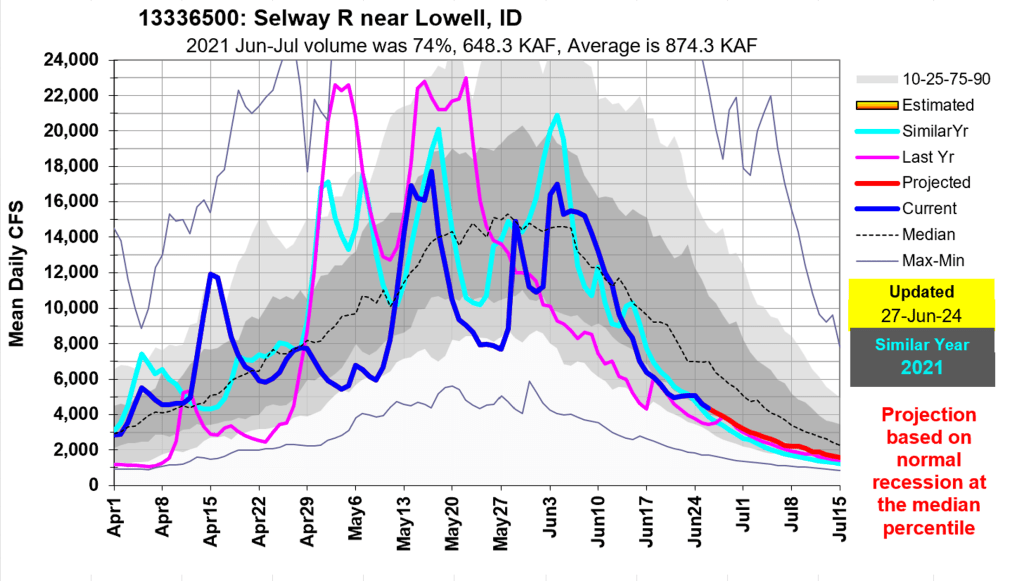
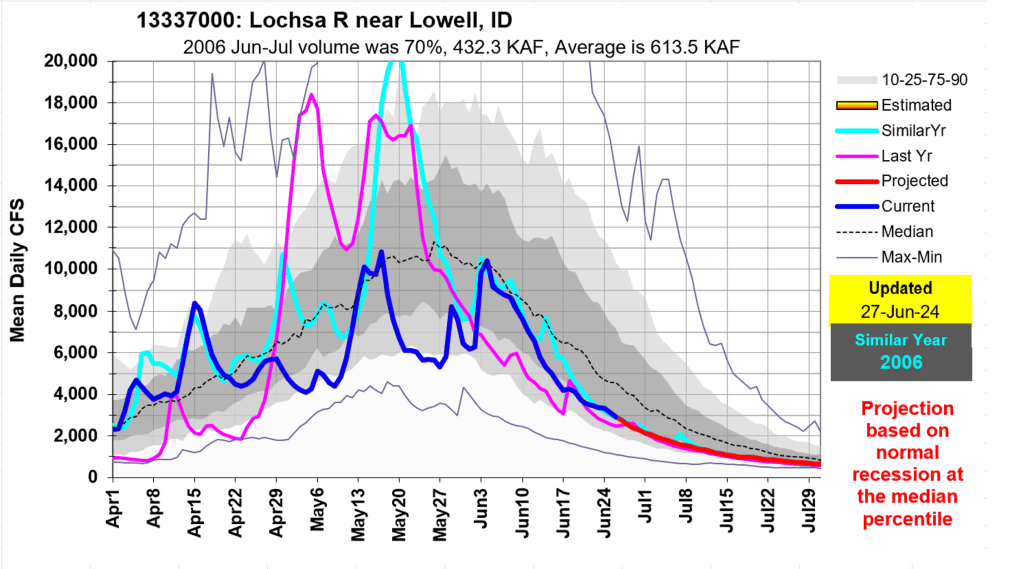
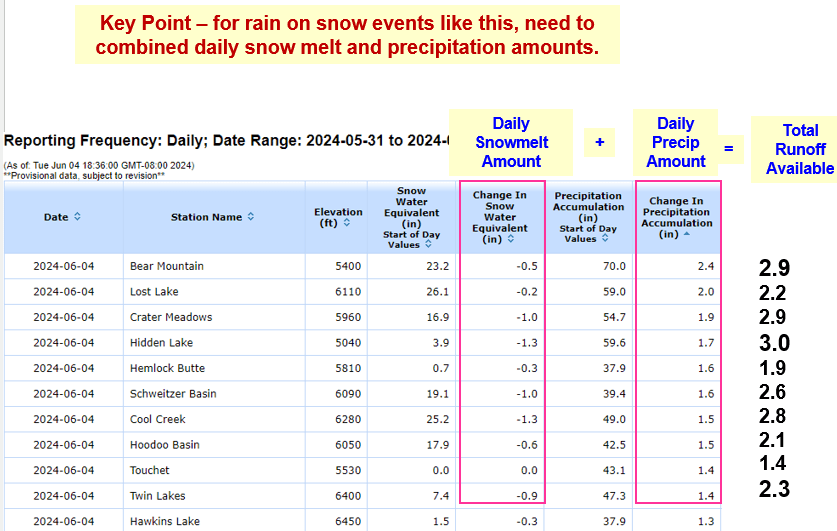
What an event it was that added much needed moisture to many Idaho rivers. Following is a statewide summary about the impacts of this early June Atmospheric River Event. This rain on snow event increased streamflow in many rivers across the state that will push recession flows out a bit.
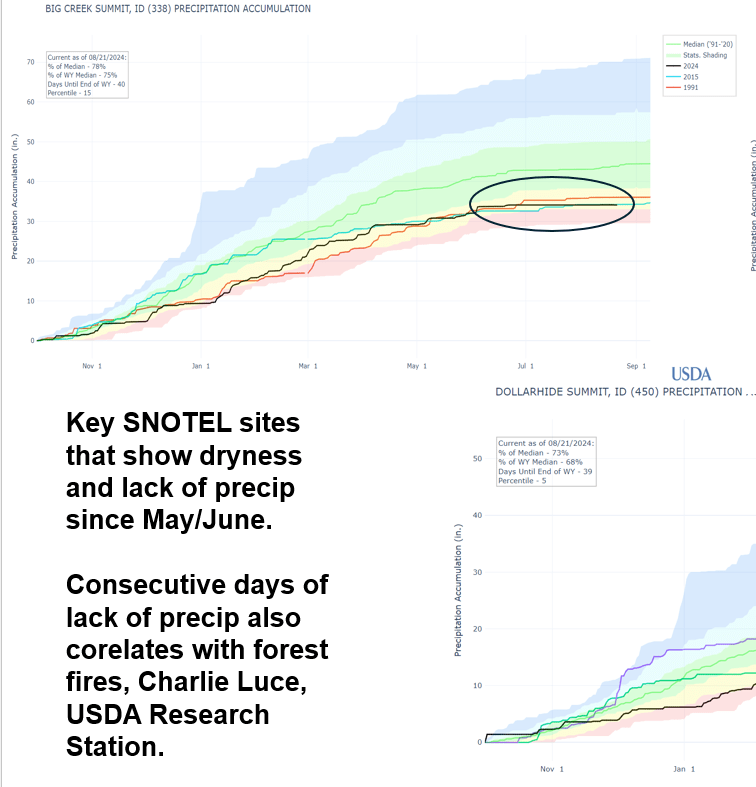
Combining daily rainfall and snowmelt resulted in 2.5 to 3.0” of Total Runoff Available at a few SNOTEL sites. The cool May temps delayed snowmelt allowing snow to remain in higher elevations that provided a runoff boost with the falling rain.
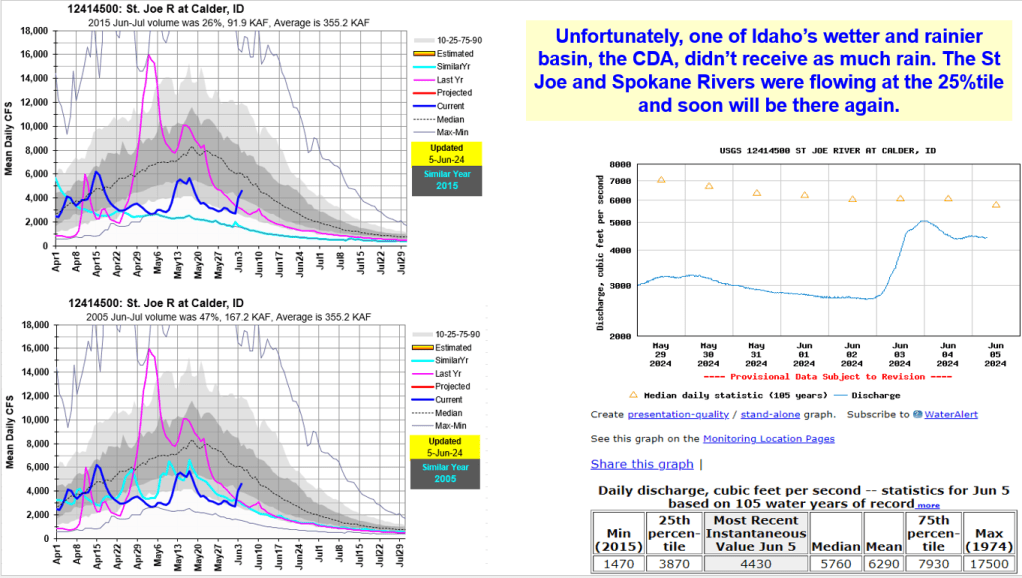
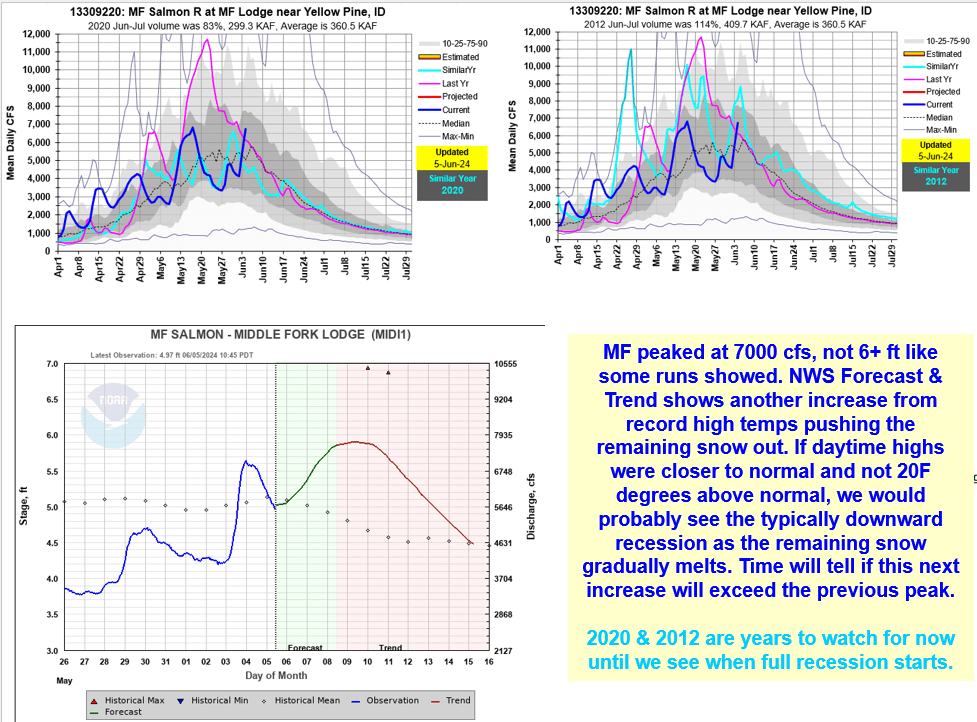
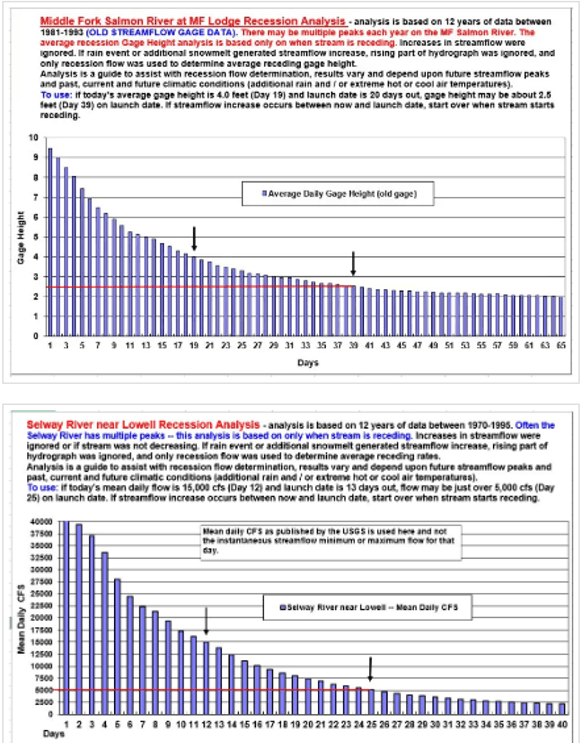
What a storm it was – who do you thank ? Those benefiting include fish, wildlife, river runners, salmon flows, hydropower production and more. The streamflow boost created another flow increase that will keep recession flows higher longer. However, some basins missed the positive impacts from this event. See the following analysis to see why some rivers benefited while others continued with their downward recession trend.
Benefits include assisting with final fill of some reservoirs, delayed irrigation water use that may even result in better reservoir carryover storage for next year. Impacts include challenges for those on rapid rising rivers especially for those adventuring on the MF Salmon River and experiencing the New Velvet Rapid up close.