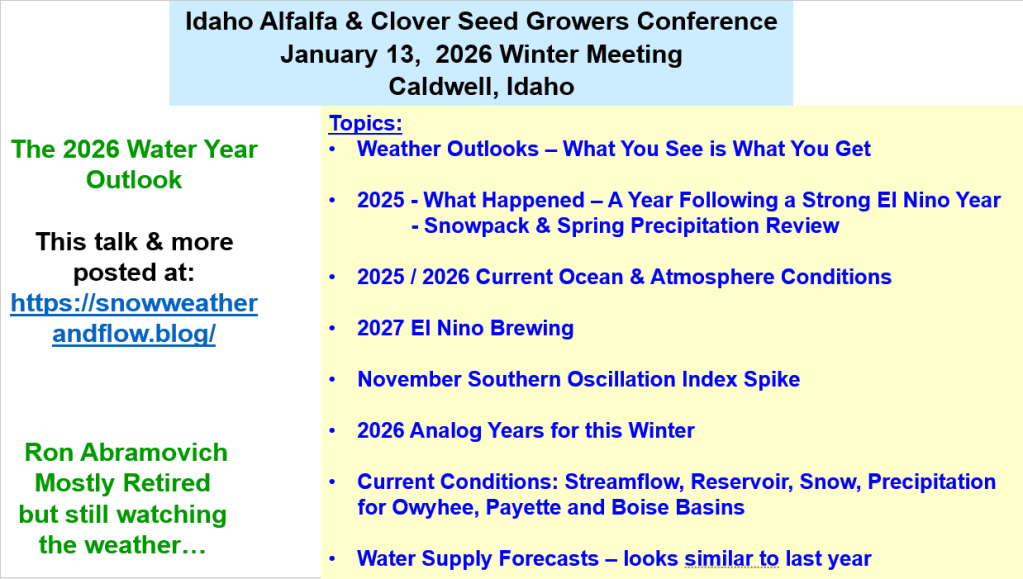
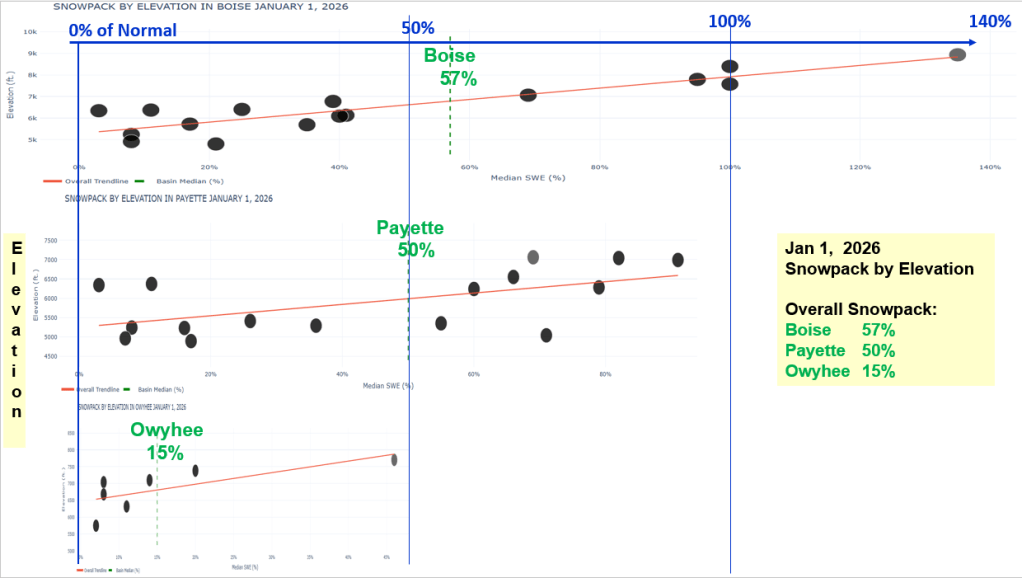
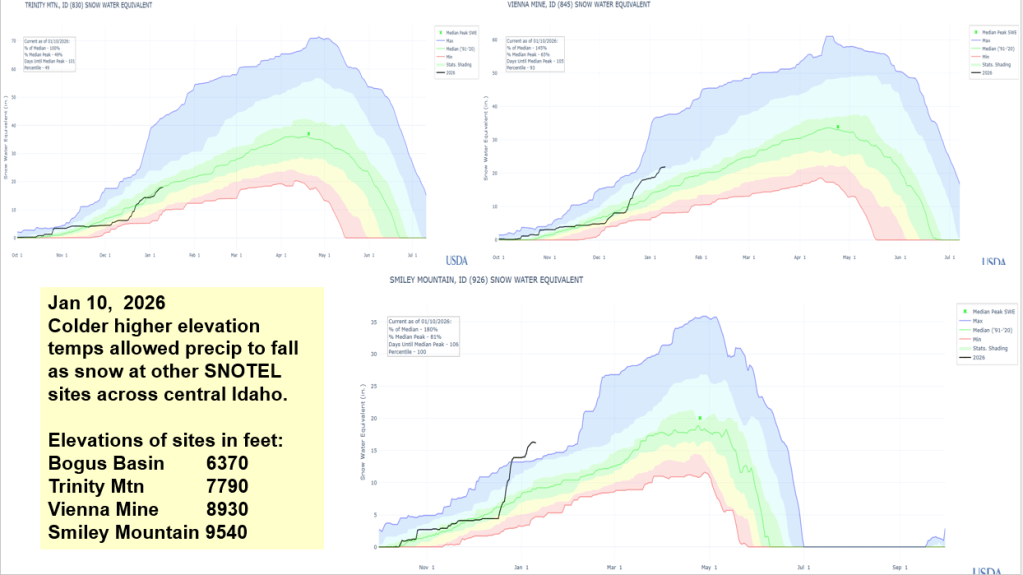
Here’s a summary of the 2025 runoff, the fall and early winter weather that created the unique elevational distribution of the snowpack and water supply outlook for the Payette, Boise & Owyhee basins. This talk was for the Idaho Alfalfa & Seed Growers Conference.
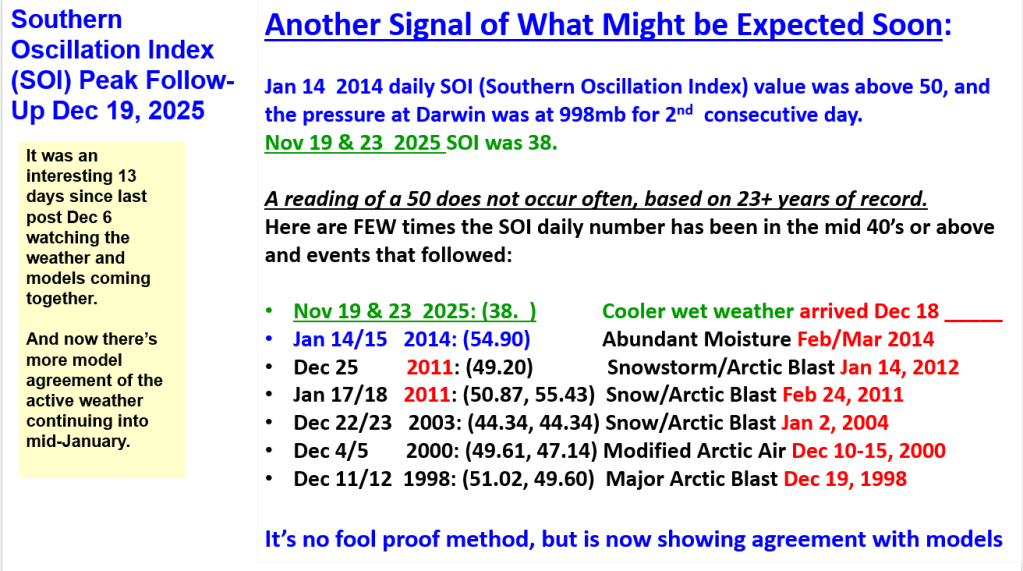
It was an interesting 13 days since last post Dec 6 watching the weather and models coming together and now there’s model agreement of the active weather continuing into mid-January.
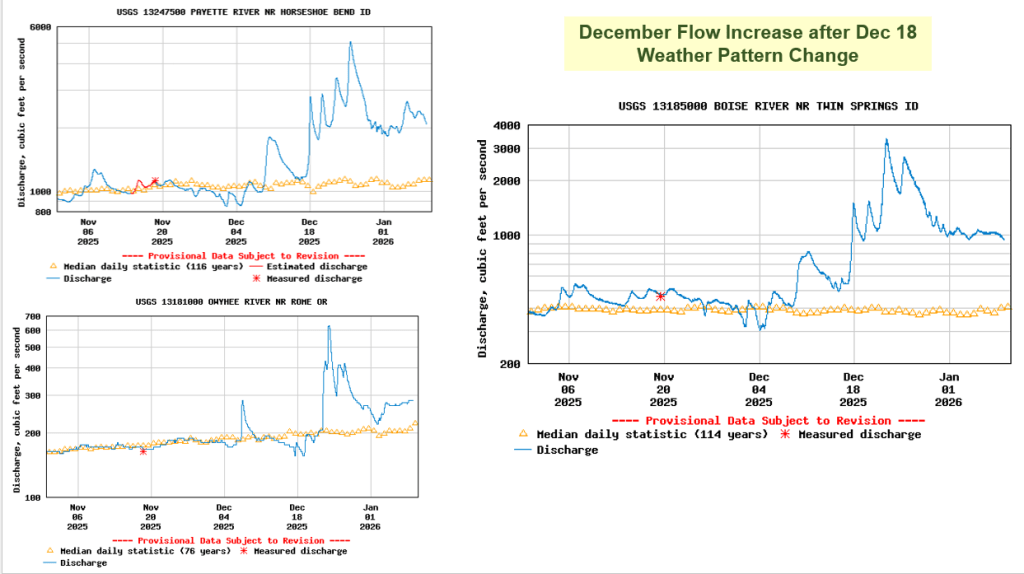
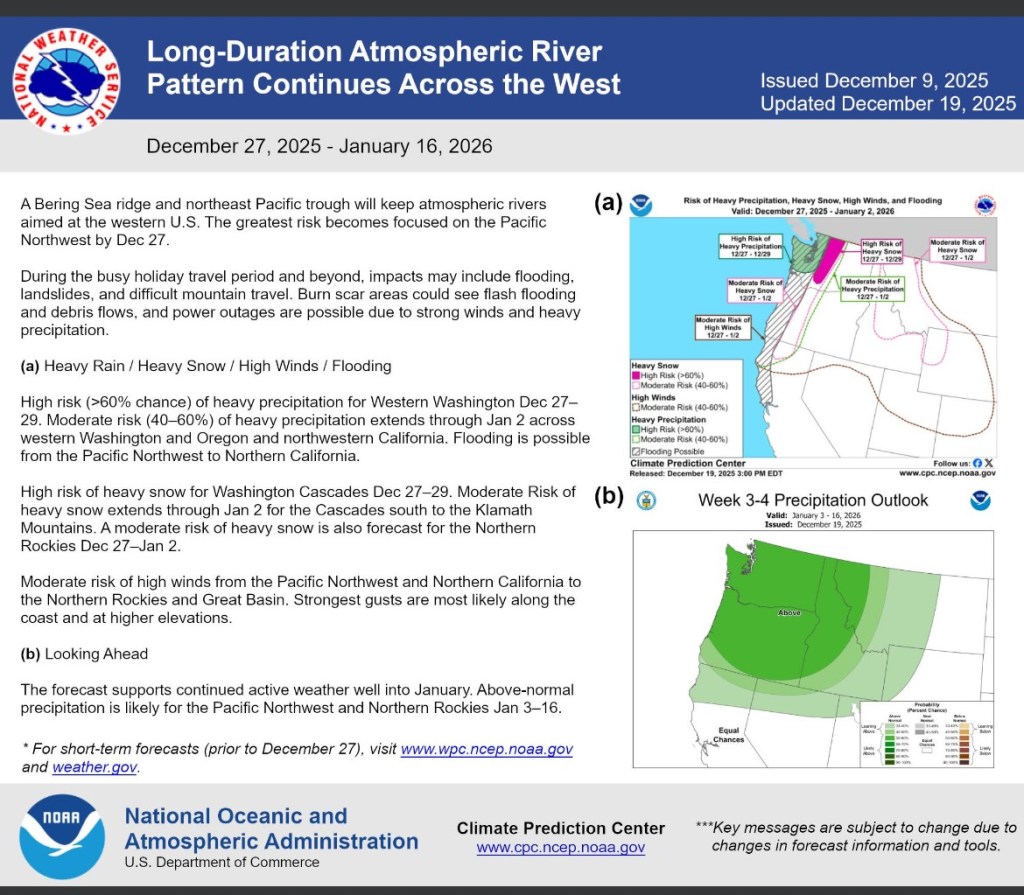
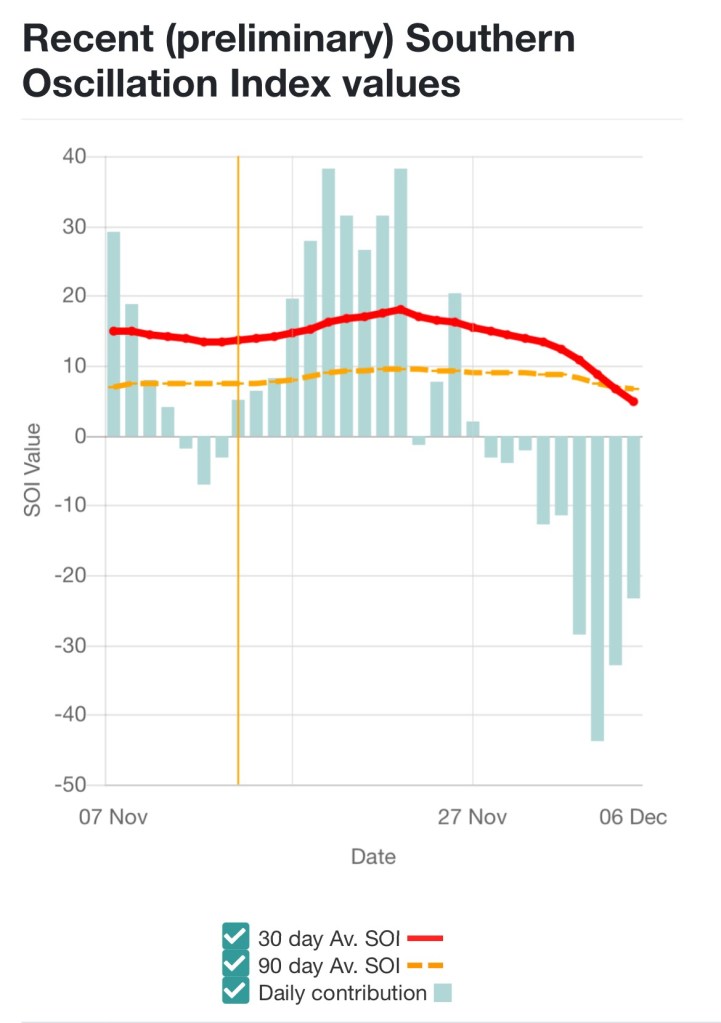
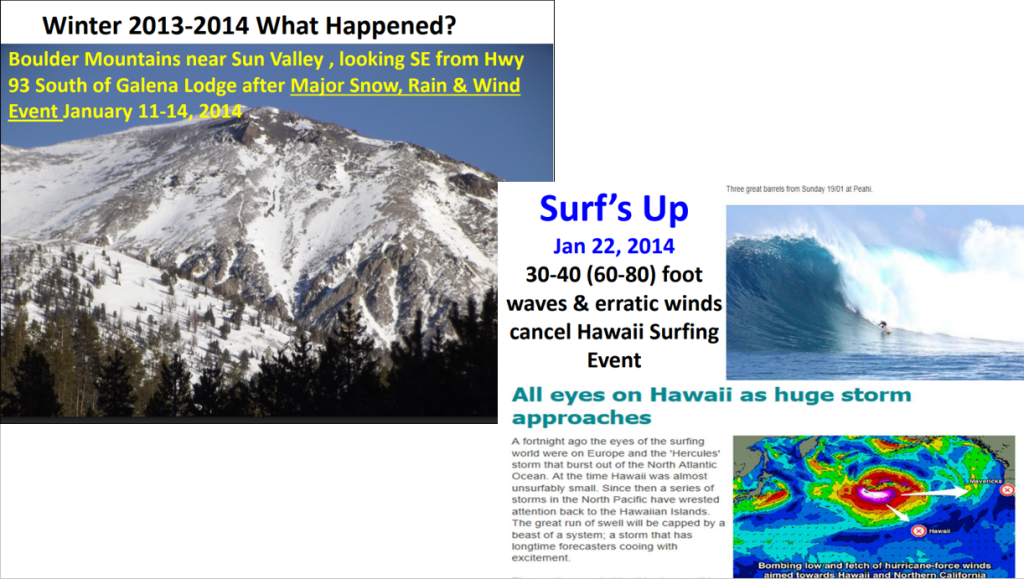
No guarantees, but if history repeats, we could see a weather pattern change around Dec 18. Here’s a summary for the November SOI Event and what I learned the winter of 2014 when it also happened ! Time will tell where the event might arrive or if the event tracks farther east.
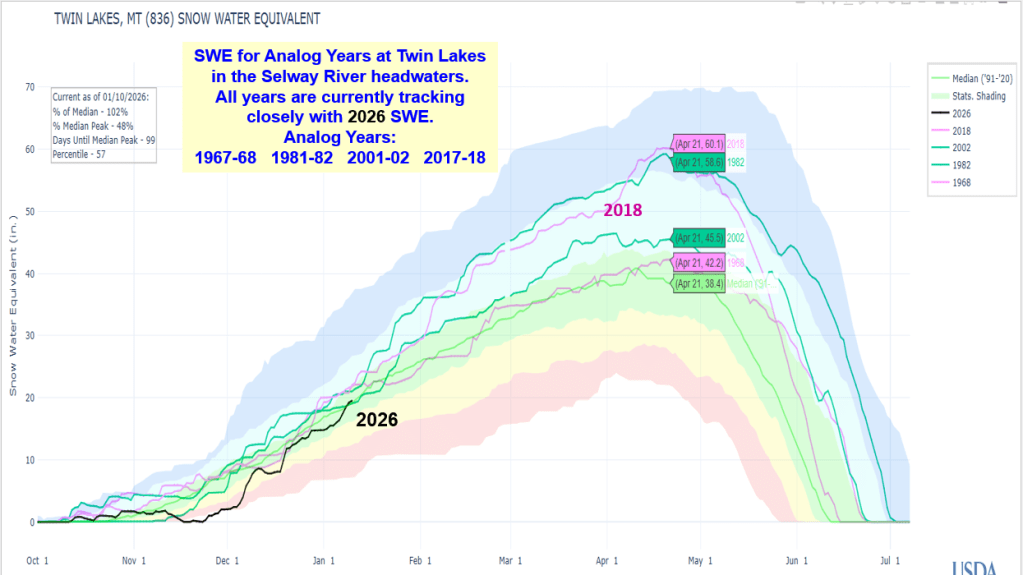
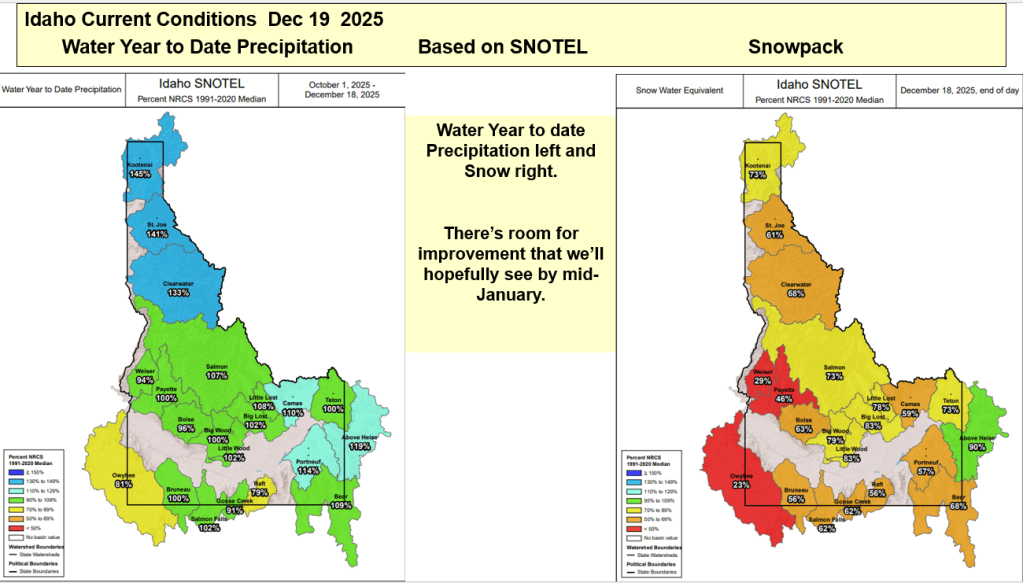
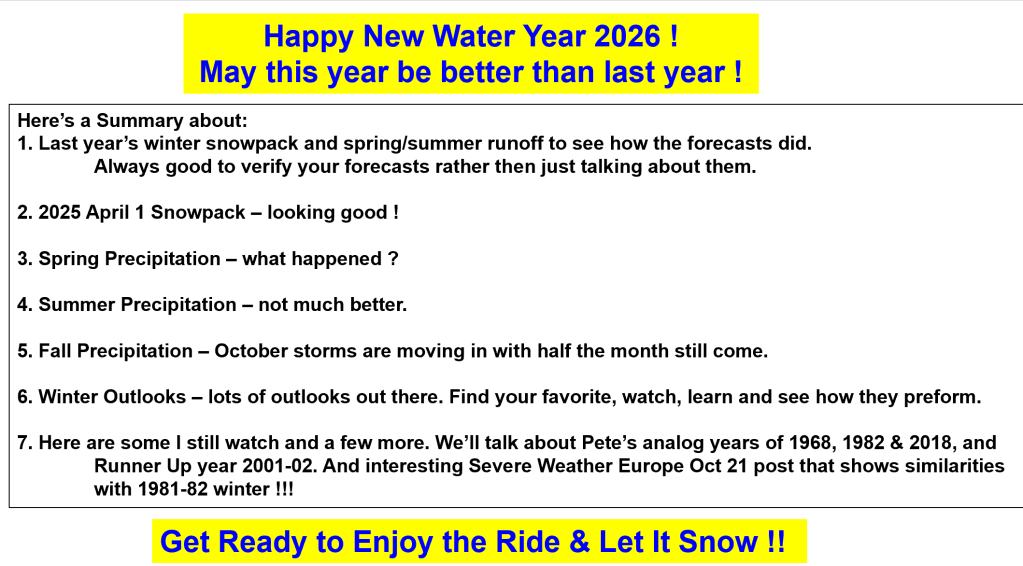
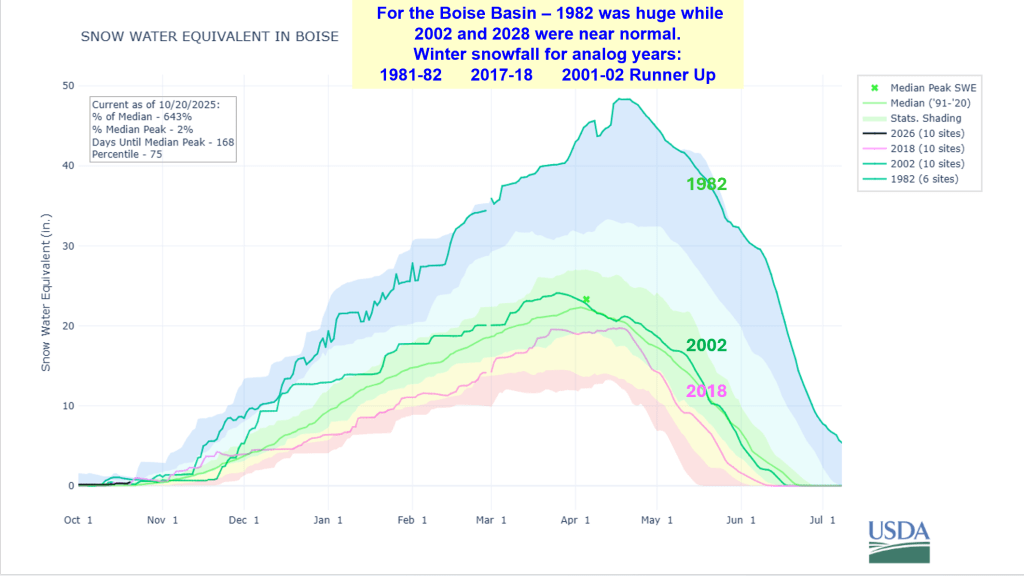
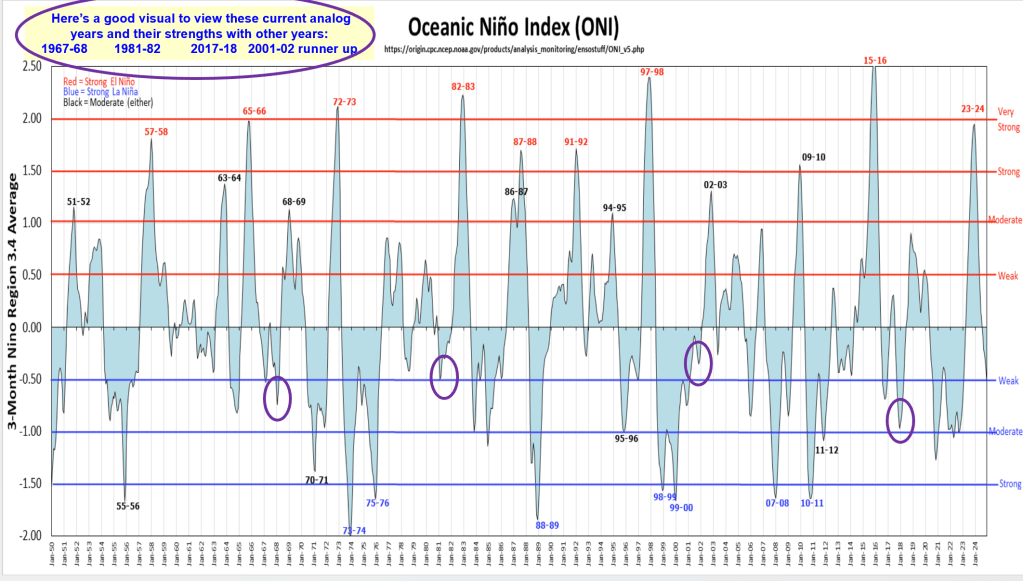
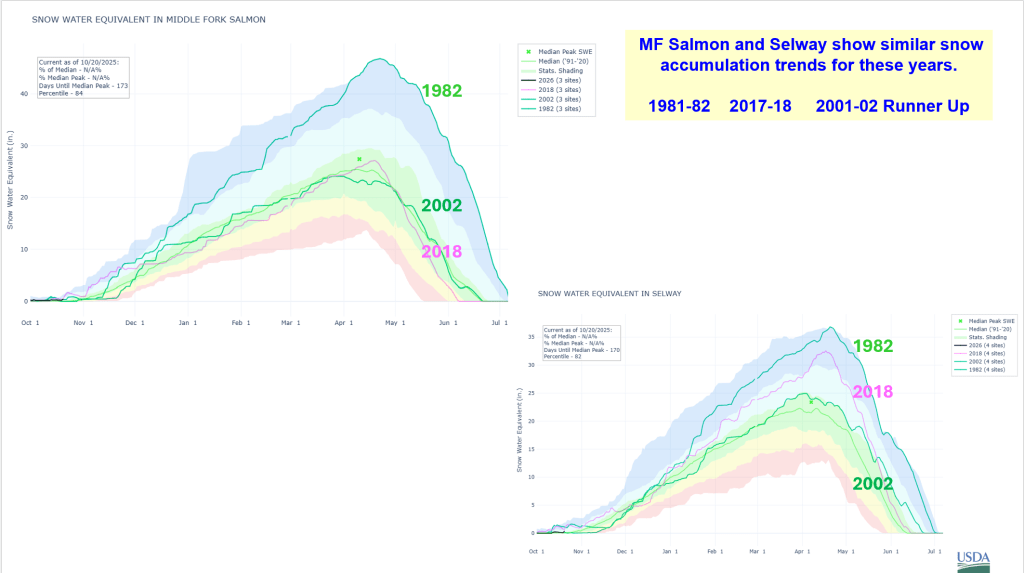
Here’s a summary of what happened to last year’s runoff because of near record dry spring. Summer is over and Fall precip is moving with a huge Atmospheric River tail that stretches over 1000 miles to SE Asia. Winter Outlooks for 2025-26 with analog years based on similar ocean conditions; we’ll watch and updated as we progress into winter. For now enjoy the wet weather as we start the new water by building our mountain snowpack.
Wow – what just hit us? Here’s a summary of the key indicators I was watching leading up to this storm. Never stop learning and watching the weather to better understand what’s happening here, around us and why.
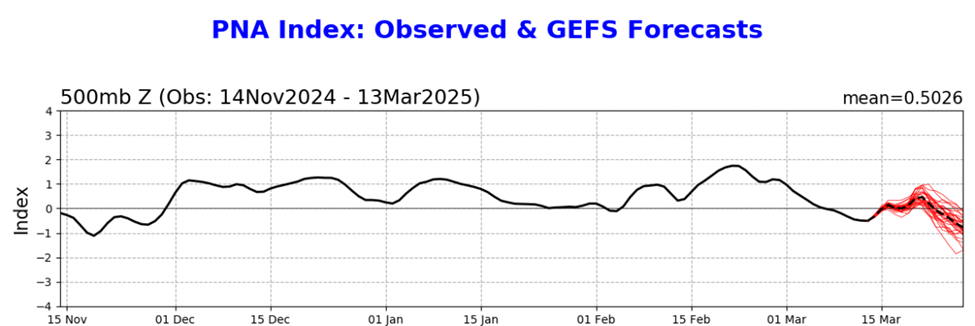
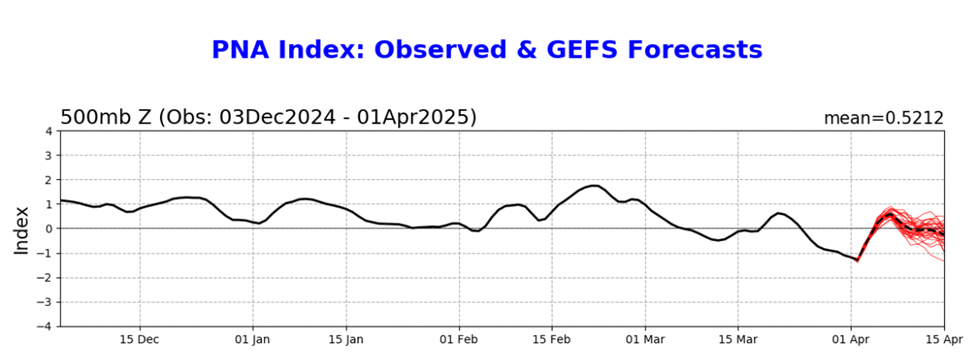
The PNA started hinting at weather system brewing back on Mar 13 with sharp decrease and biggest drop since last Nov storm. A Buoy Pop was also marked on my calendar from around same time. Always nice to see in agreement of indicators two weeks out.
Here’s current PNA which shows the Apr 1 drop, then going positive which means return to high pressure in early April.
Severe Weather Europe from Mar 31 provides a good explanation, just need to read between the Ads. They summarize the springtime battle between winter and summer patterns fighting for the lead. This probably led to the isolated weather pattern and intense storm with 10” falling at Brundage and a couple at Bogus Monday morning followed 24 hours later with 10” at Bogus while Tamarack & Brundage received a little Tuesday morning. OpenSnow forecast weather radar nailed storm hitting Bogus early Tuesday morning and not pushing north. I should have been watching the radar loop for Brundage storm. https://www.severe-weather.eu/global-weather/april-2025-forecast-stratospheric-polar-vortex-impact-cold-air-united-states-canada-fa/
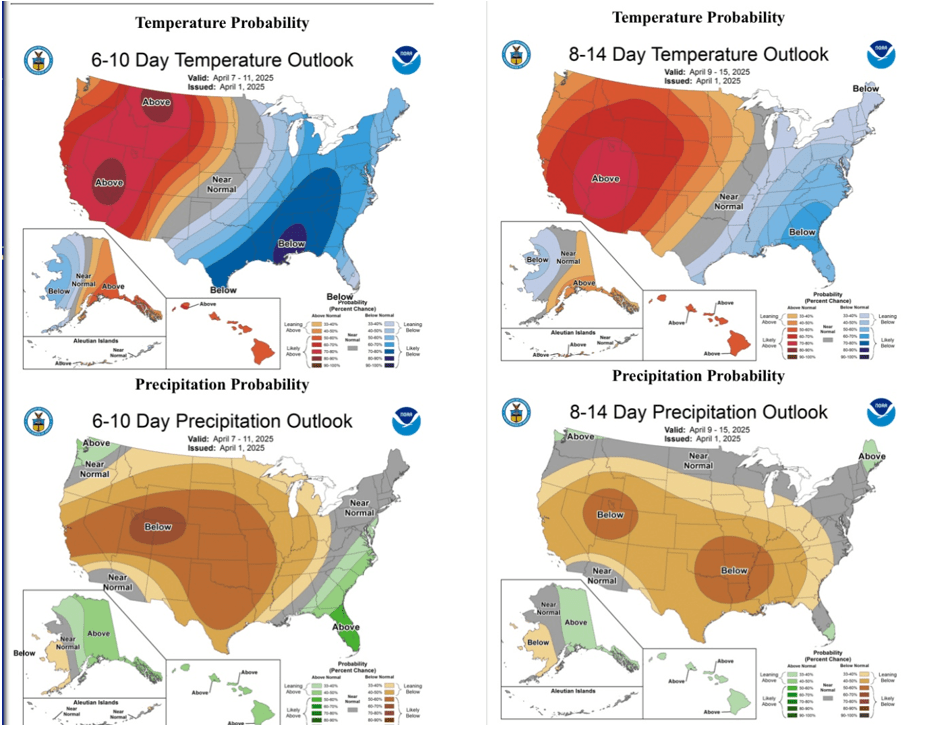
Severe Weather also provides a good summary of early April weather and why we’re gonna be warm & dry in the West and the East needs to prepare for colder and wet. Many other models are picking up intensity of this event now. Stay safe.
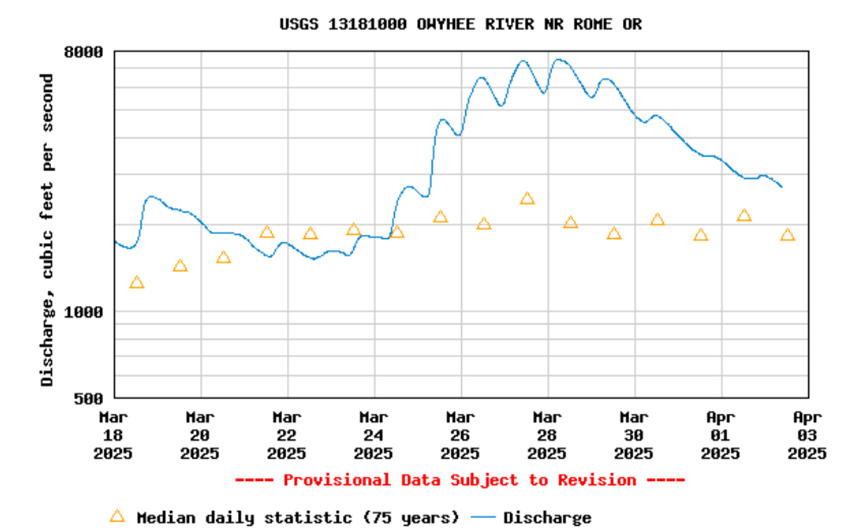
Spring skiing returns this weekend to Idaho’s southern resorts with freezing night temps and warm day temps. Enjoy while the nights are still freezing in the mountains.
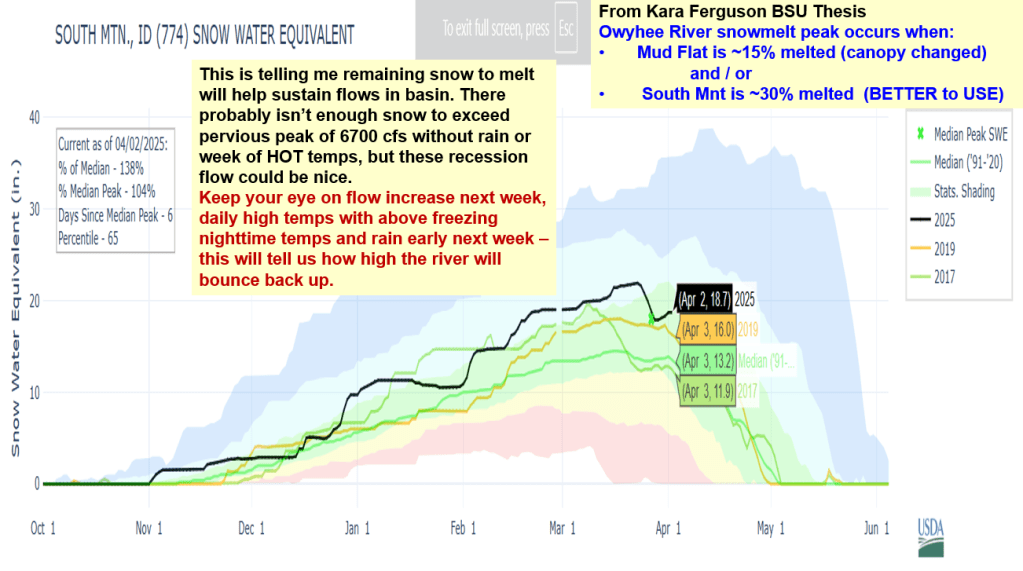
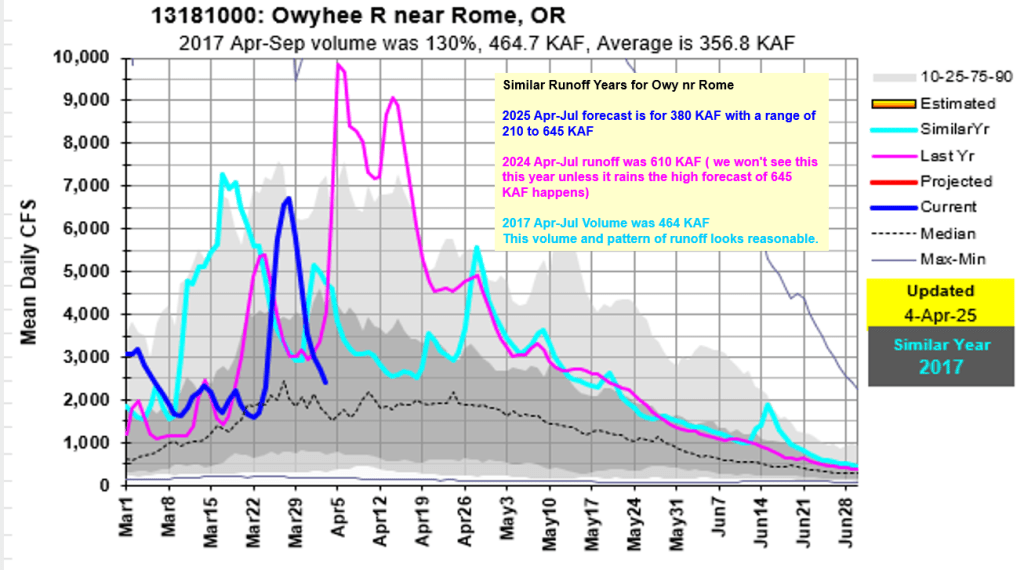
This also means the rivers will rebound with the warmer temps. Be safe out there – a friend is on a solo trip down the Main Salmon this week.
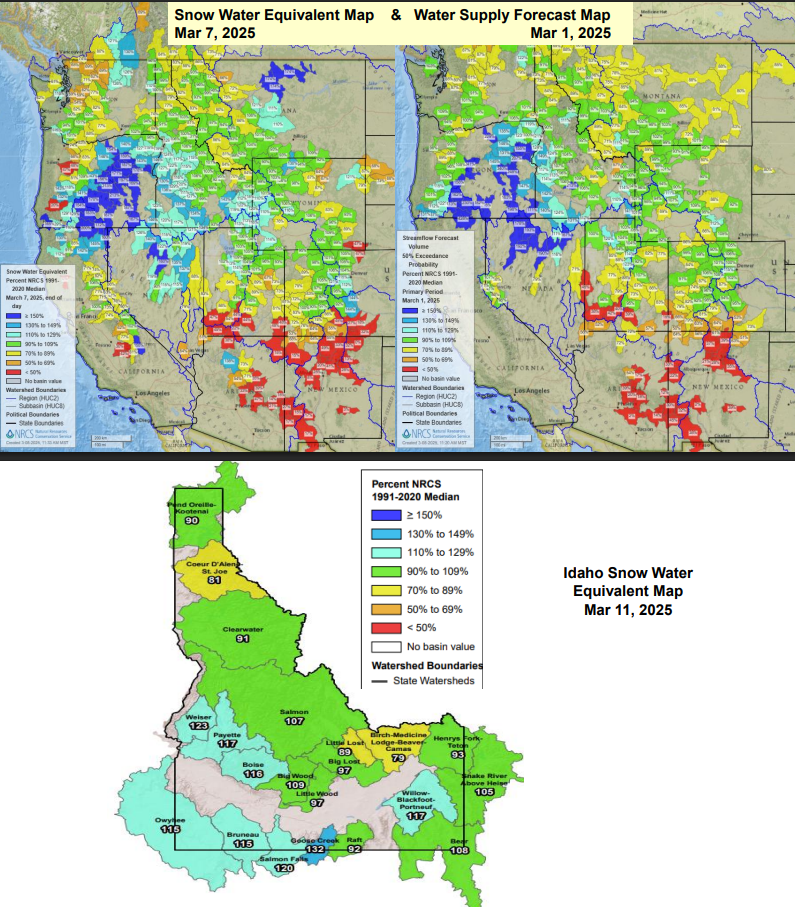
Idaho Museum of Mining & Geology talk from March 9 about 1. Current Ocean and Atmosphere Teleconnections, 2. Conditions Leading to this Year, 3. 2024 Extreme Weather & Natural Disasters, 4. Current Stream, Snow and Water Supply Forecasts with Highlights for the Payette, Boise and Owyhee Basins, and Weather Outlooks.
February brought snow measured in feet. A summary of snow depths at many ski locations across the state follows. Here are some quick facts about February’s snowfall at Bogus Basin. March 1 Bogus Basin snow depth of 83″ is the 11th deepest since 1944. SWE increase of 8.7″ during February was the 8th highest since measurements start in 1944. The snow depth on Feb 1 was 50″ and increased to 83″ by months end; this is tied for 2nd greatest change with 1949. February 2019 was huge with an increase from 36″ to 95″ by the end of February.
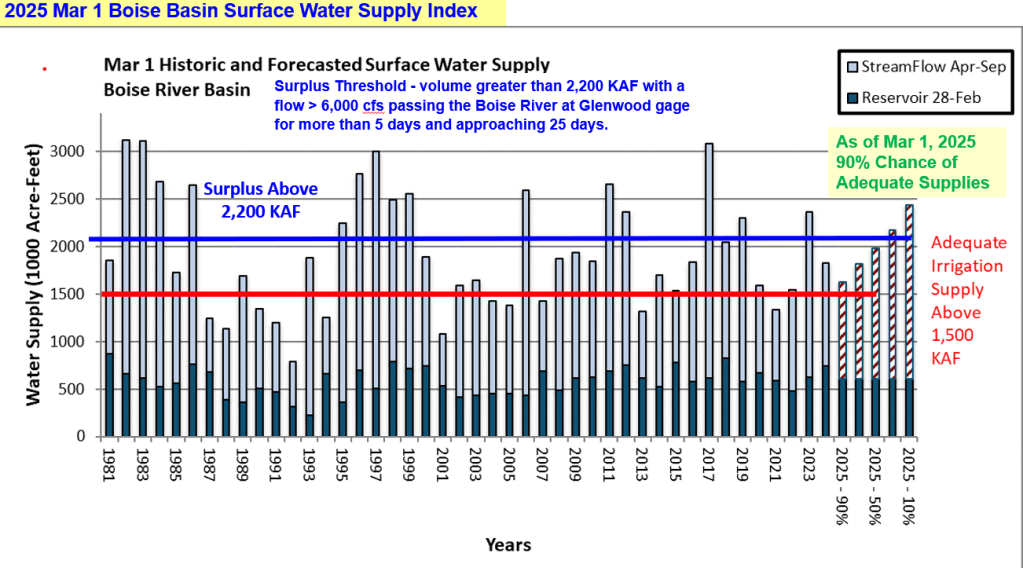
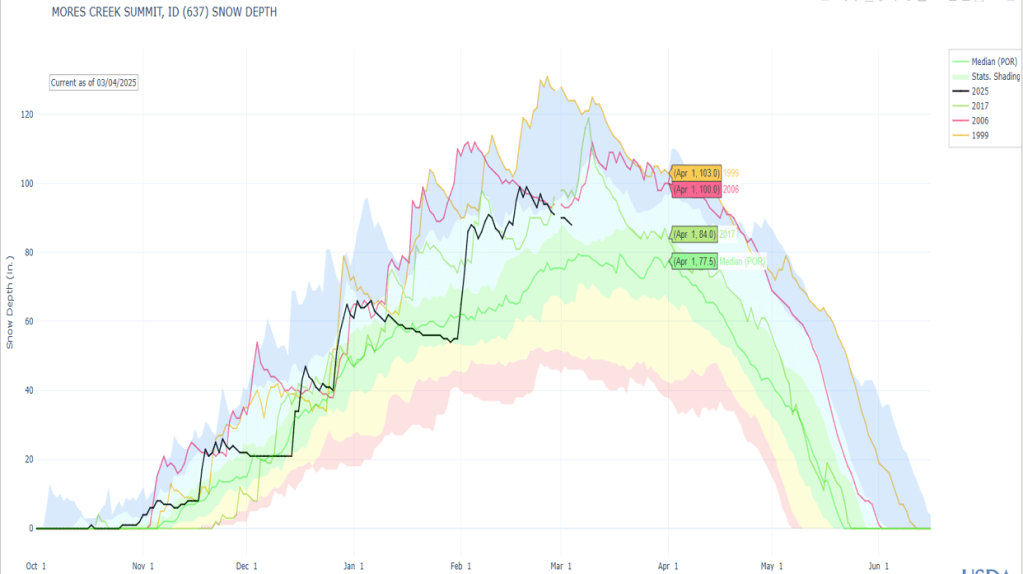
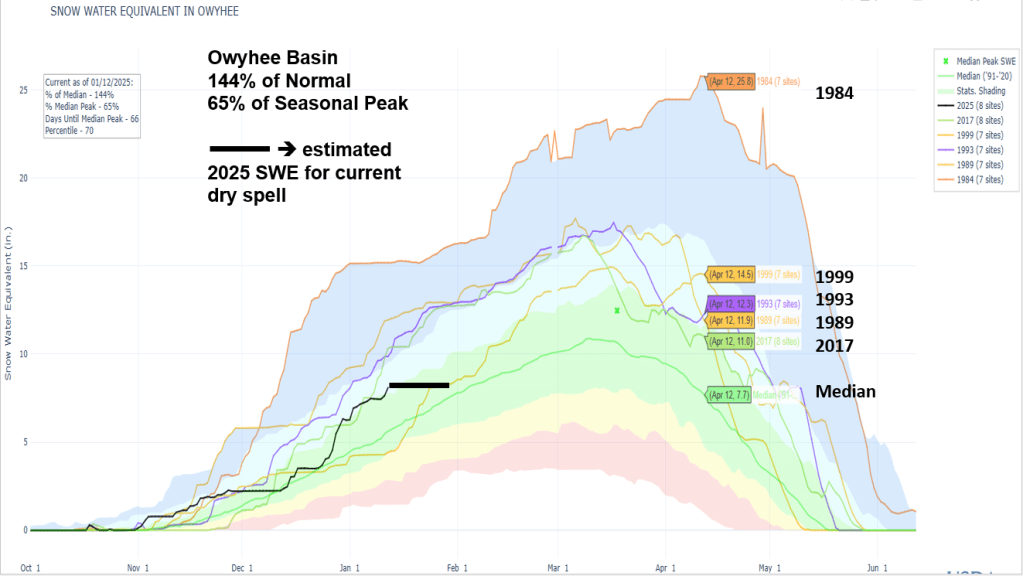
Here’s a talk given to Idaho Alfalfa & Clover Seed Growers about current conditions, analog years, acres burned, a few slides about 2024 extreme weather and disasters, and the snow & flow outlooks for the Weiser, Payette, Boise and Owyhee basins. With high, dry and cold weather here for a bit, we’re gonna loose about 1% a day, but the snow won’t be melting. Cold is good! We’ve seen winter dry spells in other years and lucky for us, SW Idaho got off to a great start this winter. Let the 2nd half of winter start – any day now…