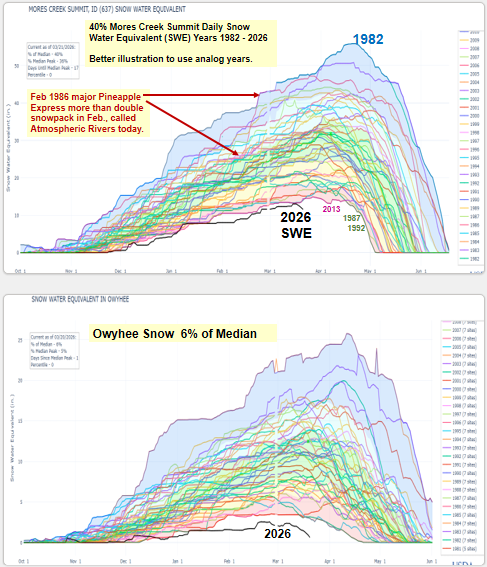
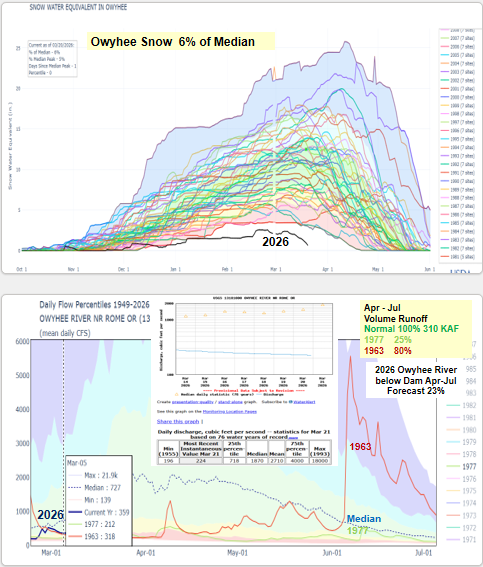
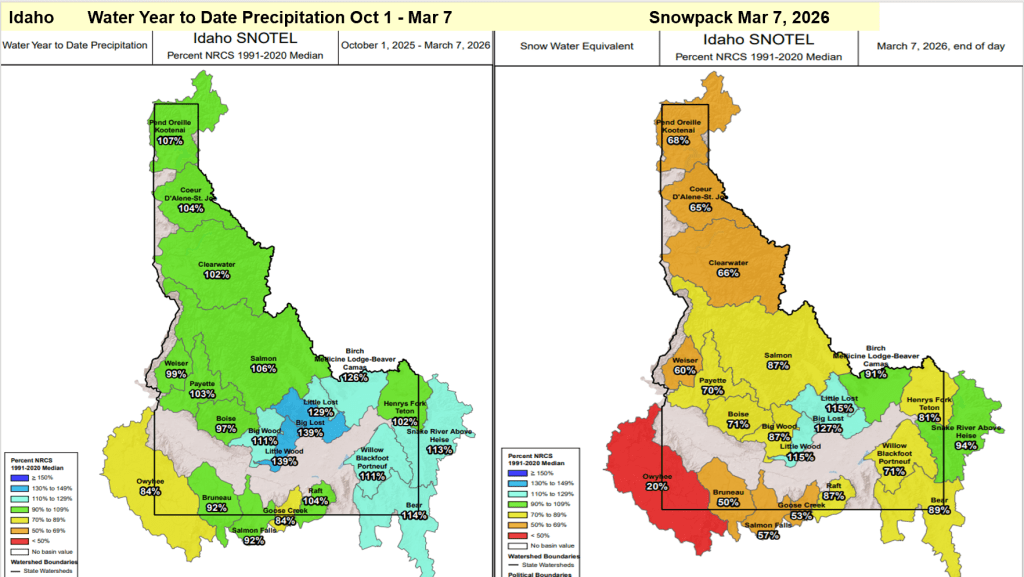
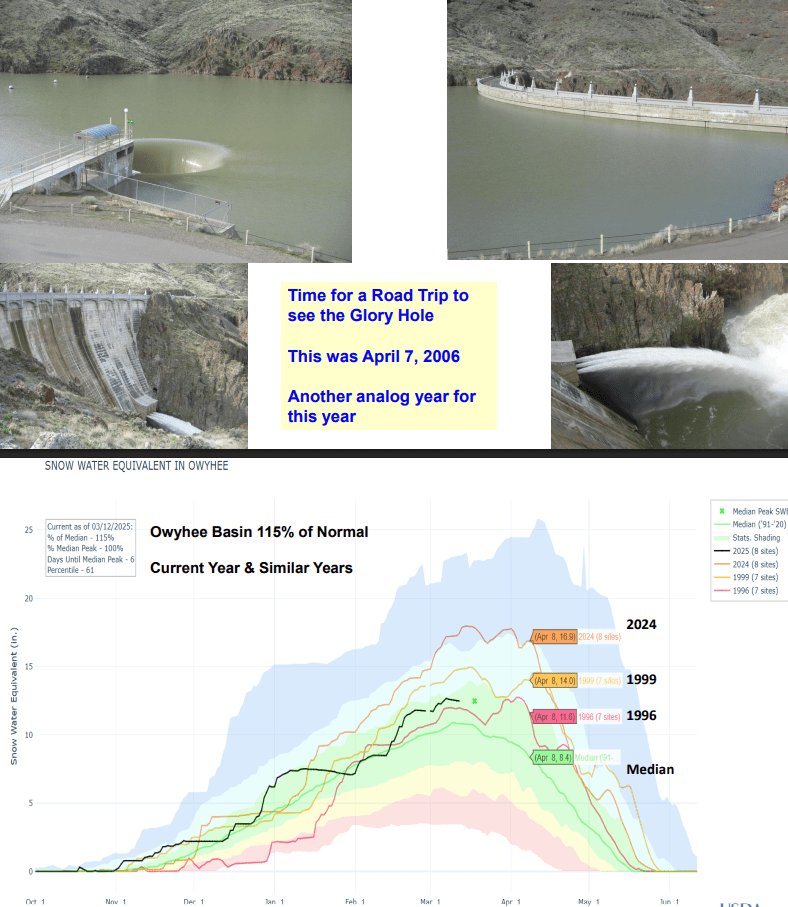
How low can we go – many headwater rivers are flowing near the bottom 10% tile level for this time of year. Any rain would help…


How low can we go – many headwater rivers are flowing near the bottom 10% tile level for this time of year. Any rain would help…


When you see the Buffalo Fork snowmelt runoff peak happen in the upper Snake River basin, you know the snowmelt runoff season is winding down. Here’s an update with similar recession years to help in monitoring this year’s flow. Projections are made for some rivers if a peak wasn’t happening.


Alphabetical flow graph summary – includes most Idaho rivers across the state and similar runoff years. Short on time to do full analysis but wanted to share.


For MF, Main Salmon, Selway & Lochsa and a few more – Owyhee, Bruneau and Salmon Falls Creek. Enjoy, be safe and keep and eye on the weather and flow levels for changing conditions.


Snow2Flow Update for: MF & Main Salmon Rivers – Selway & Lochsa Rivers and a few more: Owyhee, Camas Creek and Salmon Falls Creek
Snow is melting, rivers are rising, enjoy and be safe. Know your limits.


Here’s a snow & flow update for the Salmon, MF and Selway rivers and a Lochsa Bonus. Current snow conditions are displayed with analog years mentioned in previous posts. Streamflow forecast are from the NWS around Jan 20 and compared to observed runoff the analog years. January 15 is consider the half way point for winter. Overall the snow is in good shape because of the great start, but more snow is need after this dry January as show in image below.


With more snow accumulating in our mountains, let’s look at how this year compares with other years that follow Strong El Nino Years. In the past, we’ve had some good snow and flow years following Strong El Nino Years. The easiest way to explain this is – it seems the oceans and atmosphere has a lot of energy to get rid of the following year. Let’s see if we can still use the past to predict the future and how the snow is tracking.
Here’s our new table of Strong and Very Strong El Nino Years and the years that follow. You can quickly see by the color shading that only a few are below 80% of average, and rest are near average, above average or outstanding with greater than 150% of average runoff.

Here’s the big picture for the Salmon River. This snow index is based on about 20 SNOTEL sites. It also shows that this year, 2025, is tracking these years that follow a Strong El Nino Year.

Looking at Hoodoo Basin which has daily SWE starting in 1967 also shows it was a good snow year. Interesting to note that Pete’s analog years were also 1967, 1993 and 2017 which all followed Strong El Nino Years.

With some moisture moving in this weekend, we’ll soon see which rivers benefit from the moisture and which basins the moisture helps to slow the fires progress. This update has a few weather outlooks, and projected flow graphs along with comparisons to see how the Aug 6 flow projections preformed. Projections were pretty good. Rivers are easier to project when they are approaching their seasonal lows for the year.


