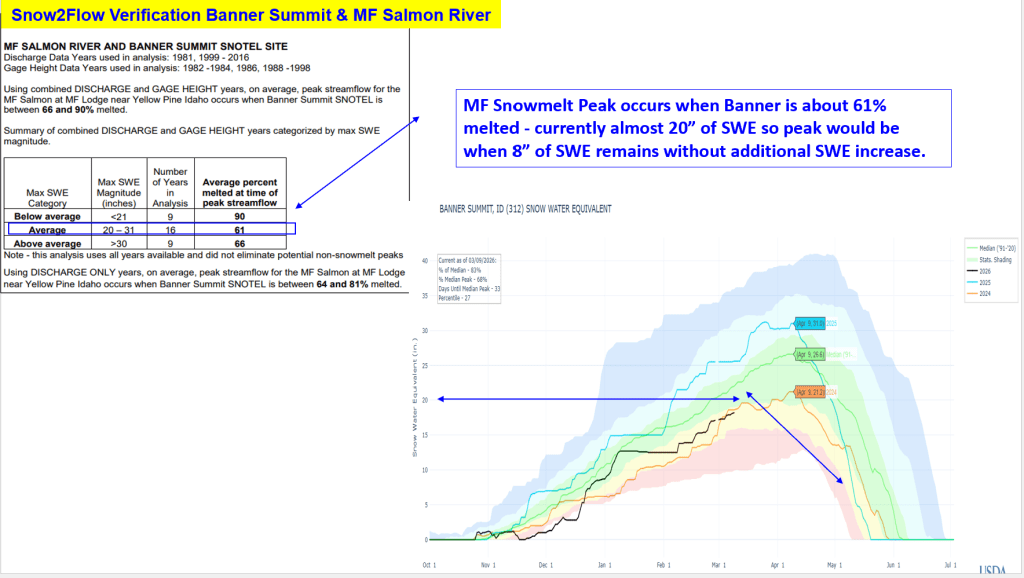
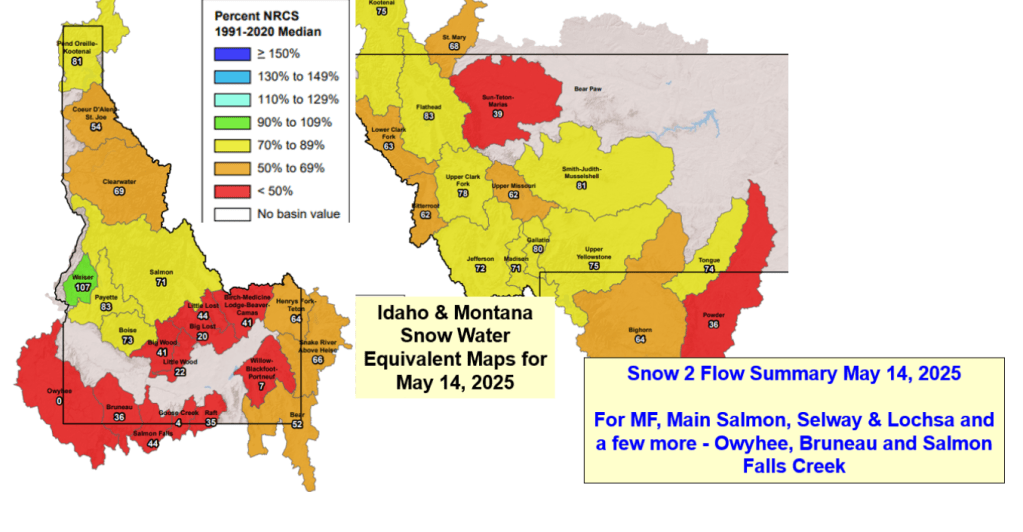
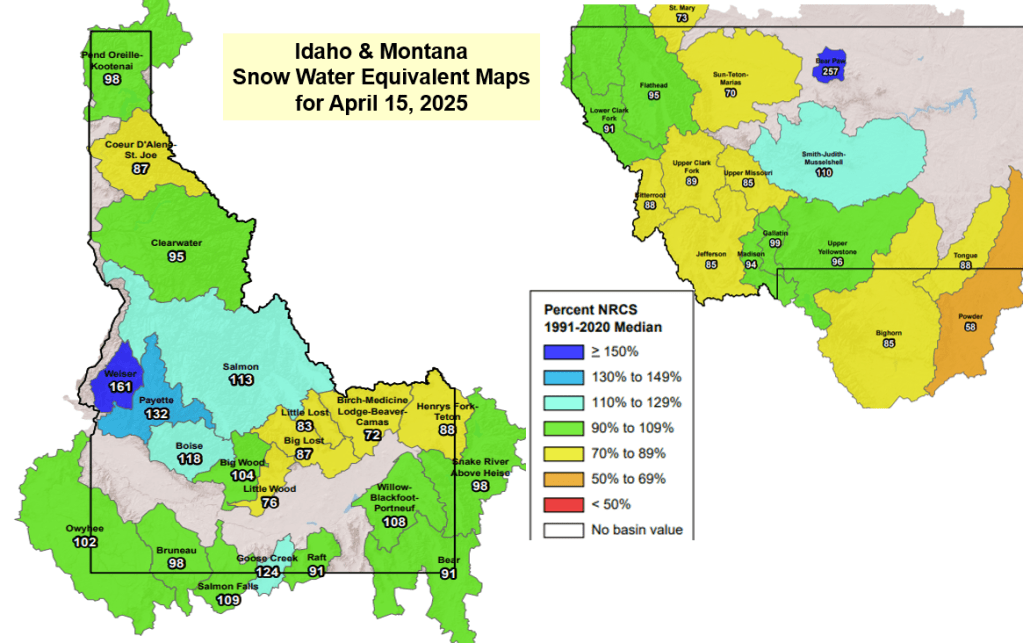
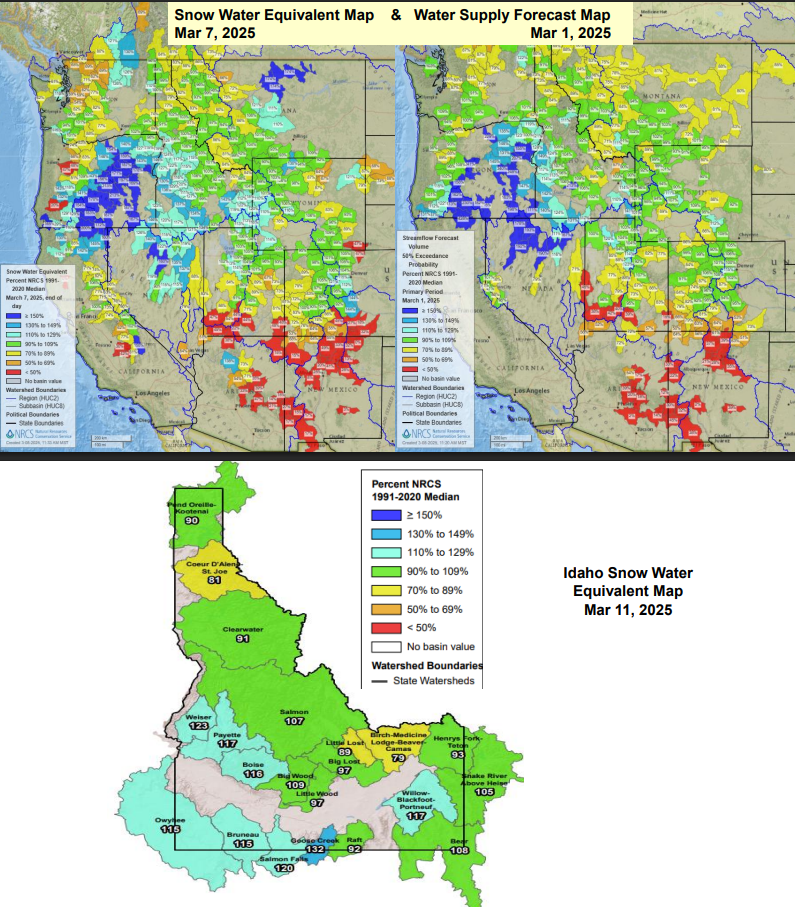
Here’s a summary of current snow water supply conditions for Idaho’s 4 River Lottery Rivers. Short on time for complete analysis but this should provide current info about the accumulation of this winter’s unique snowpack and where we are compared to other years.
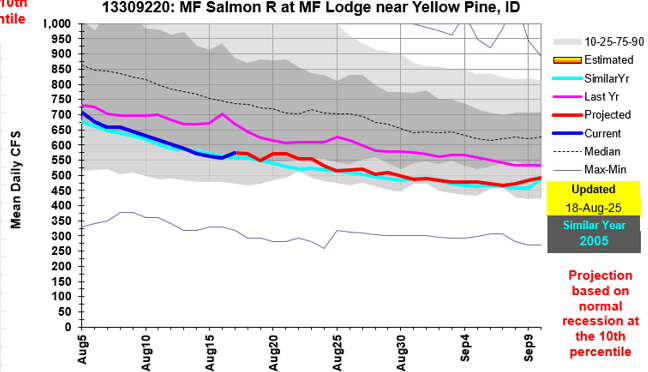
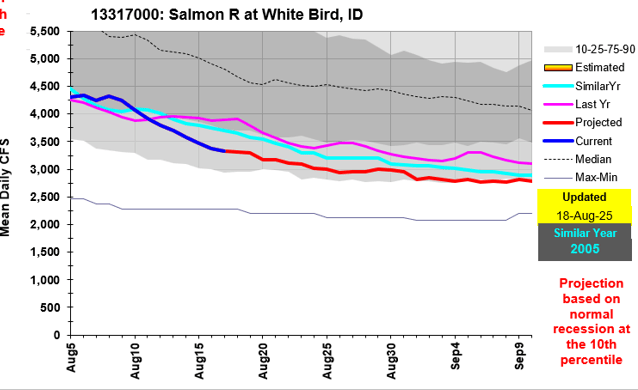
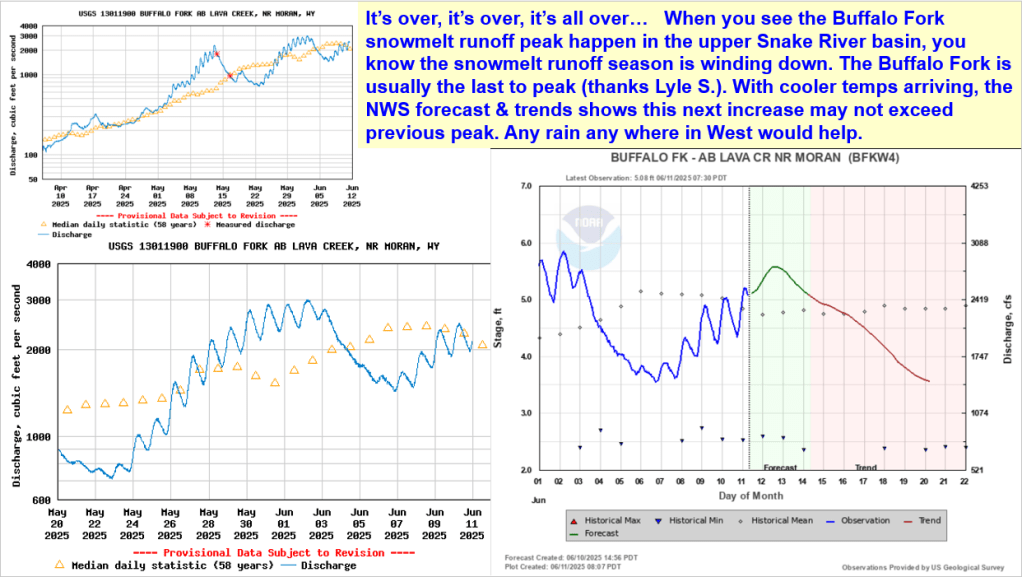
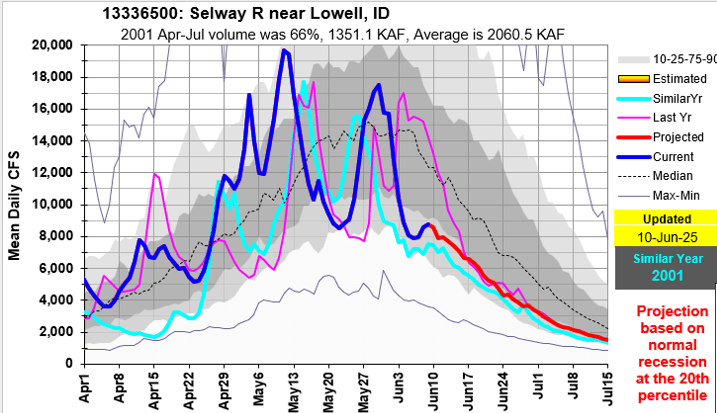
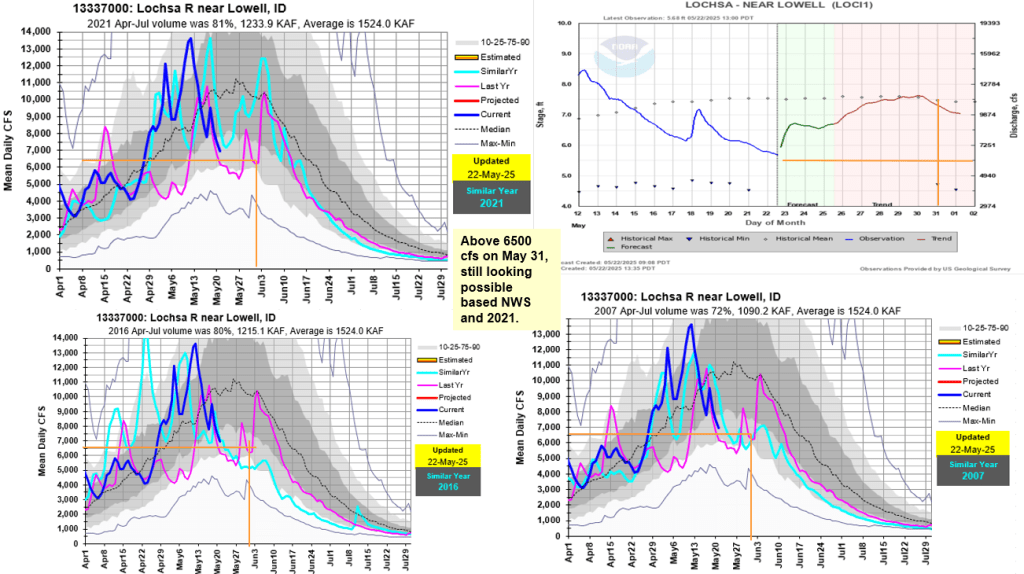
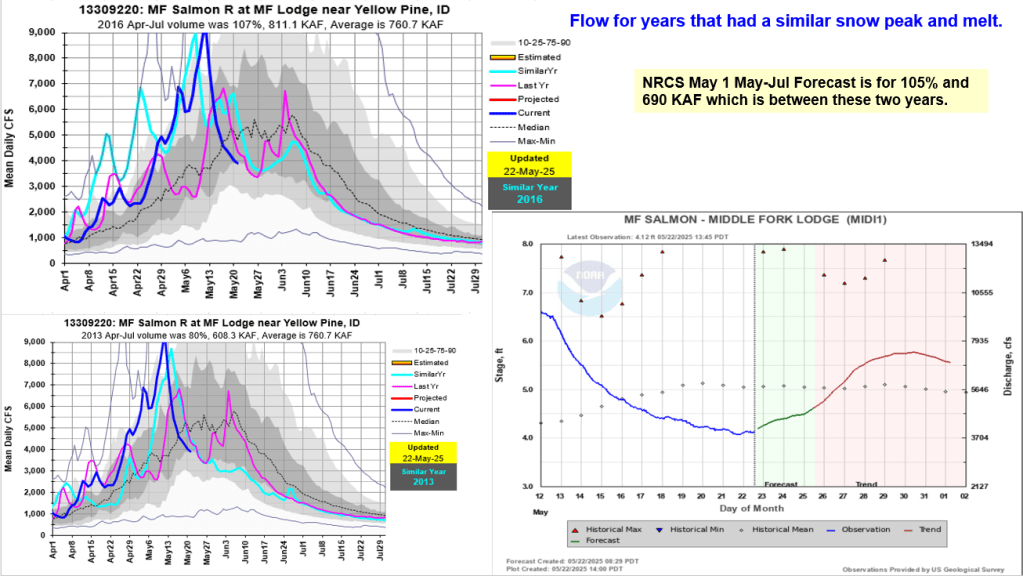
When you see the Buffalo Fork snowmelt runoff peak happen in the upper Snake River basin, you know the snowmelt runoff season is winding down. Here’s an update with similar recession years to help in monitoring this year’s flow. Projections are made for some rivers if a peak wasn’t happening.
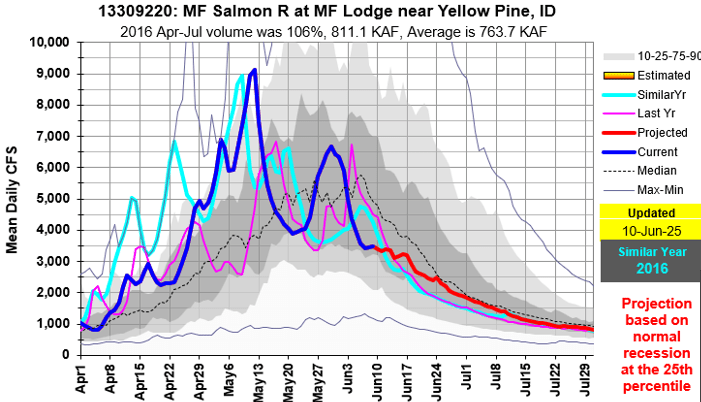
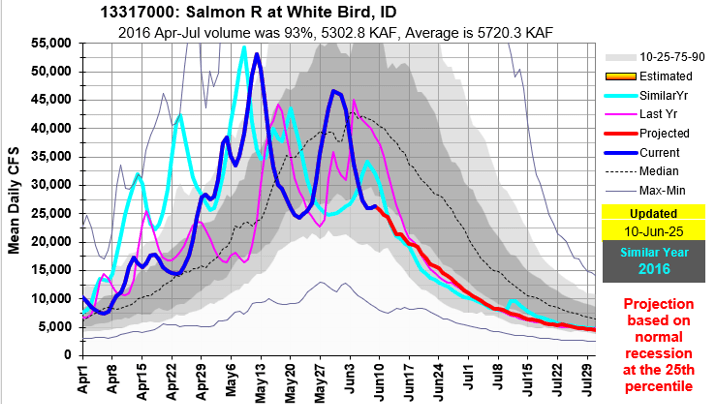
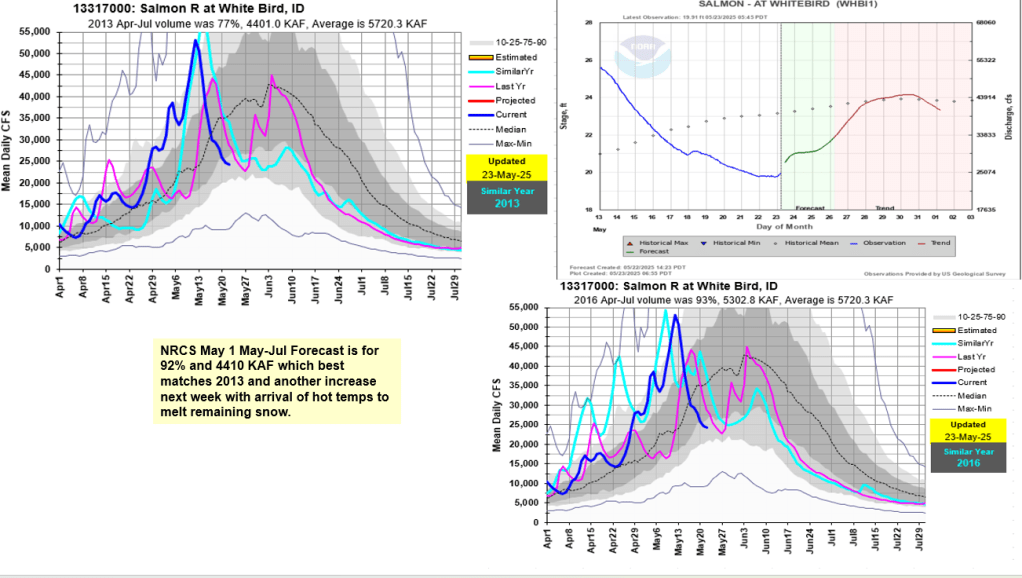
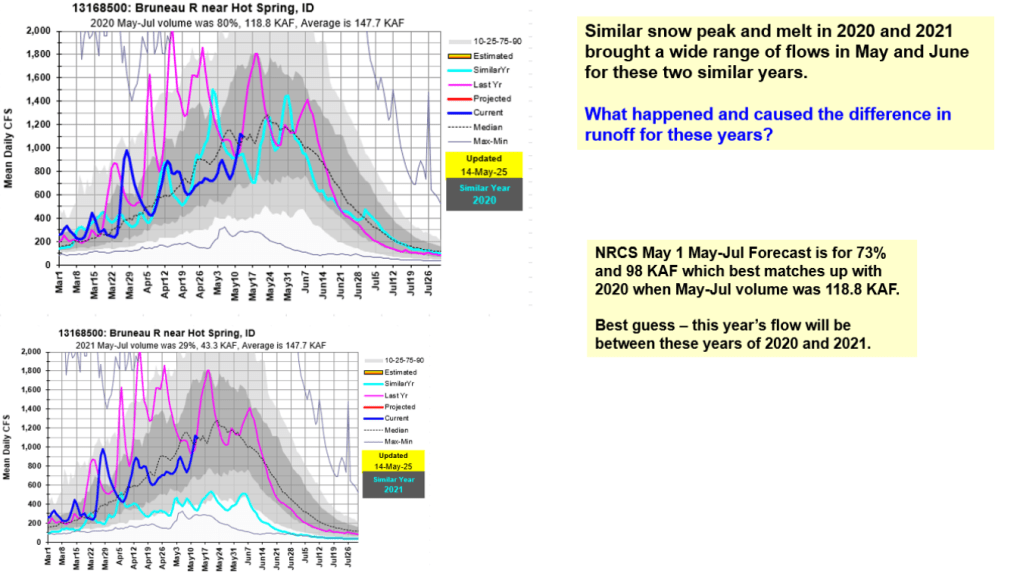
Alphabetical flow graph summary – includes most Idaho rivers across the state and similar runoff years. Short on time to do full analysis but wanted to share.
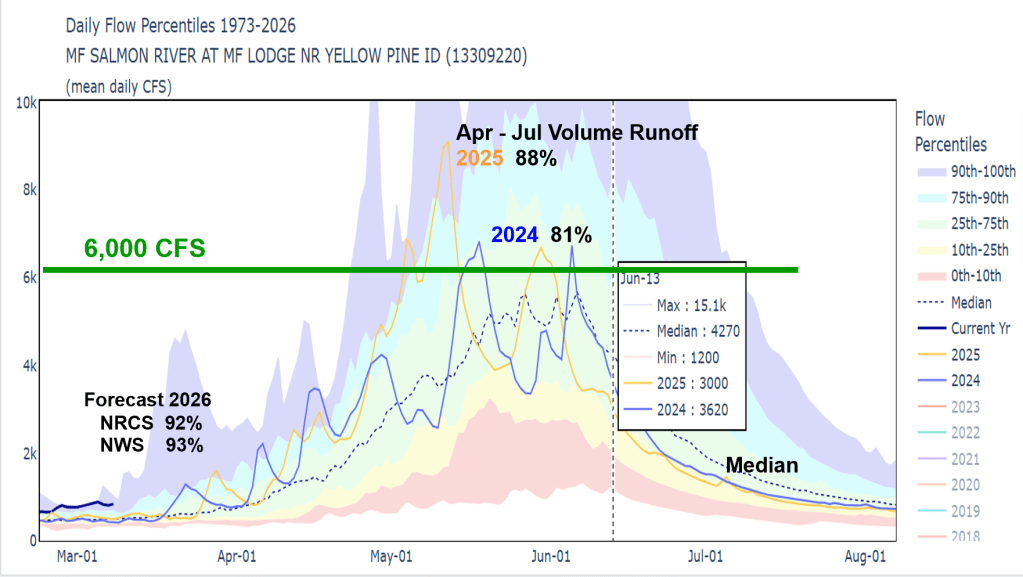
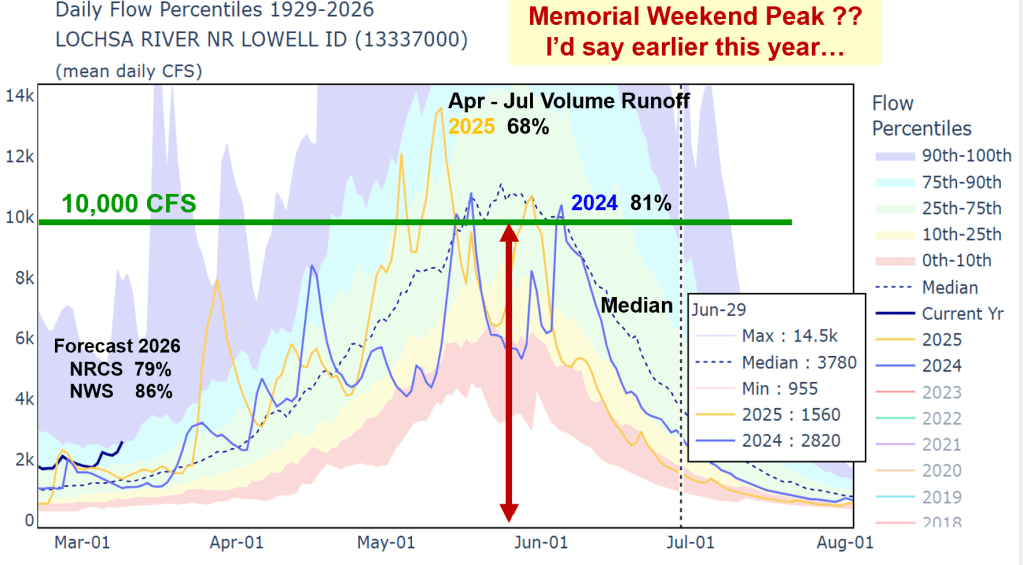
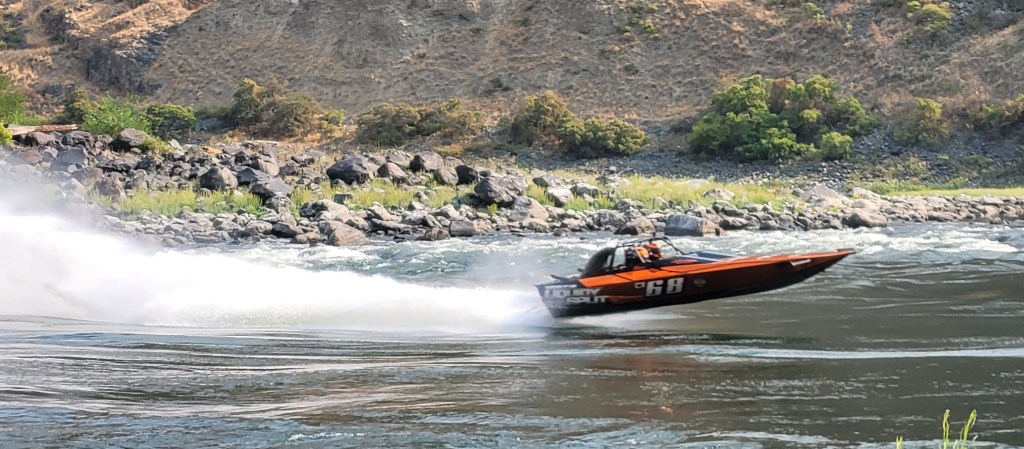
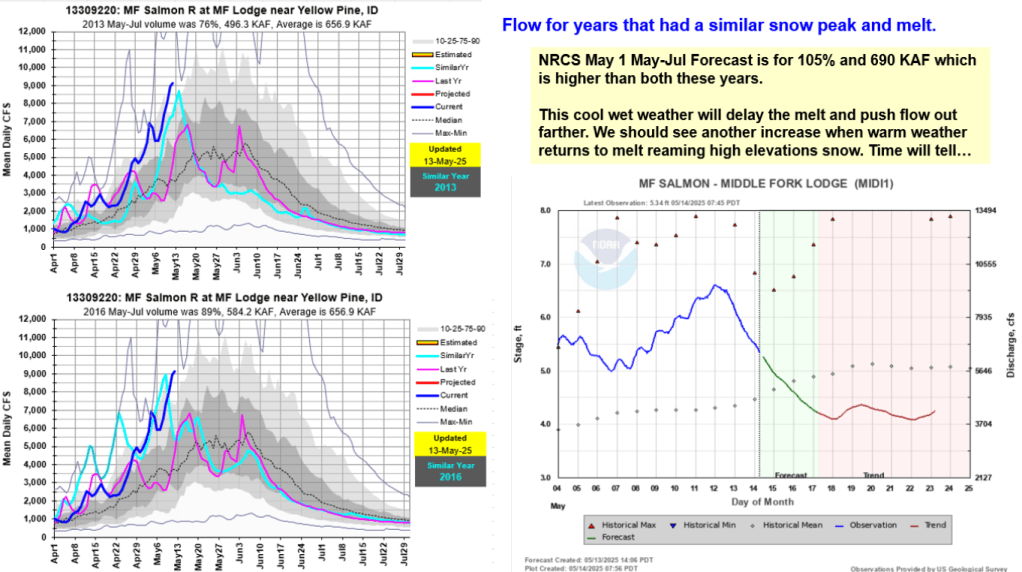
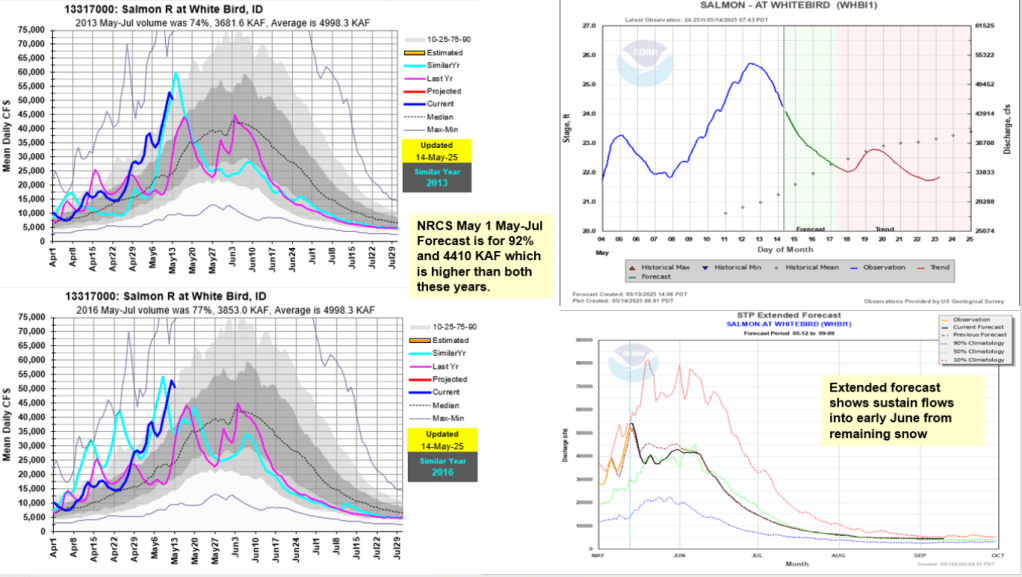
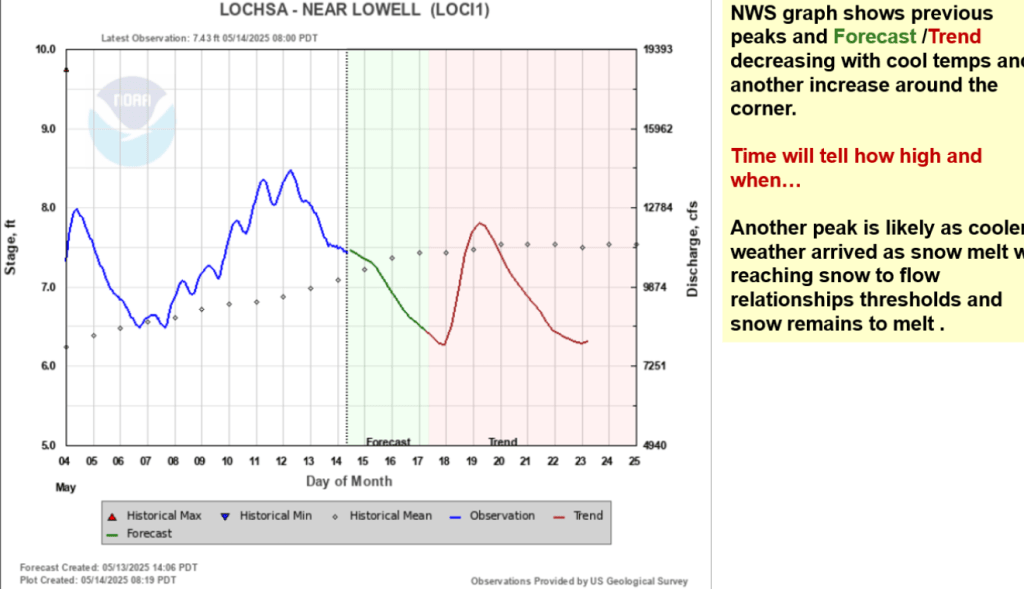
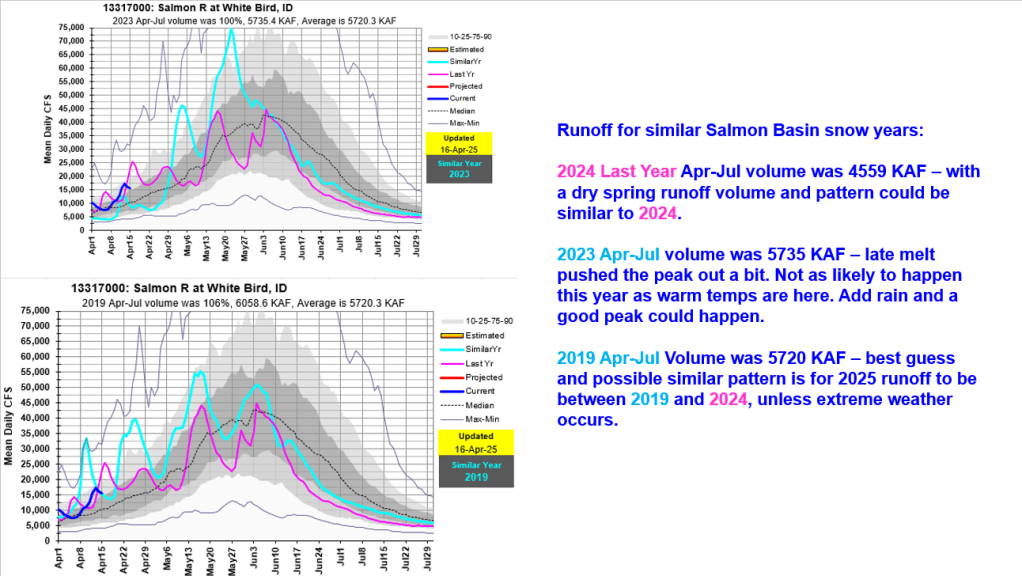
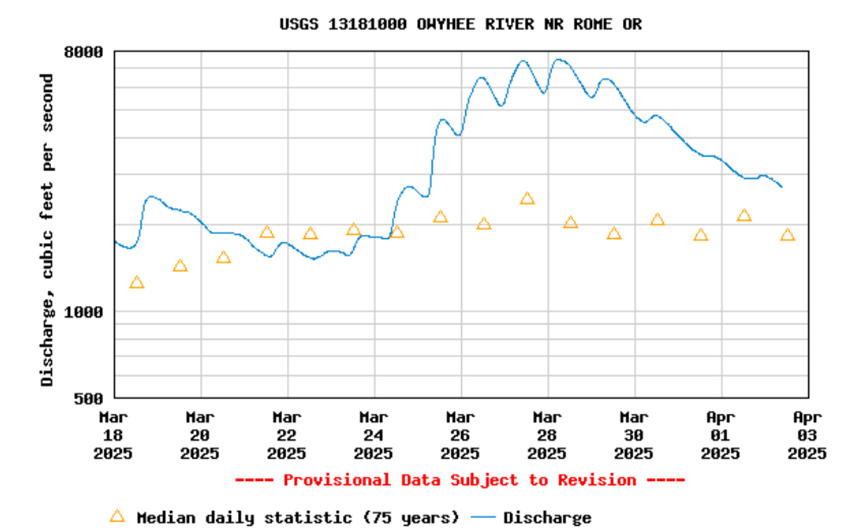
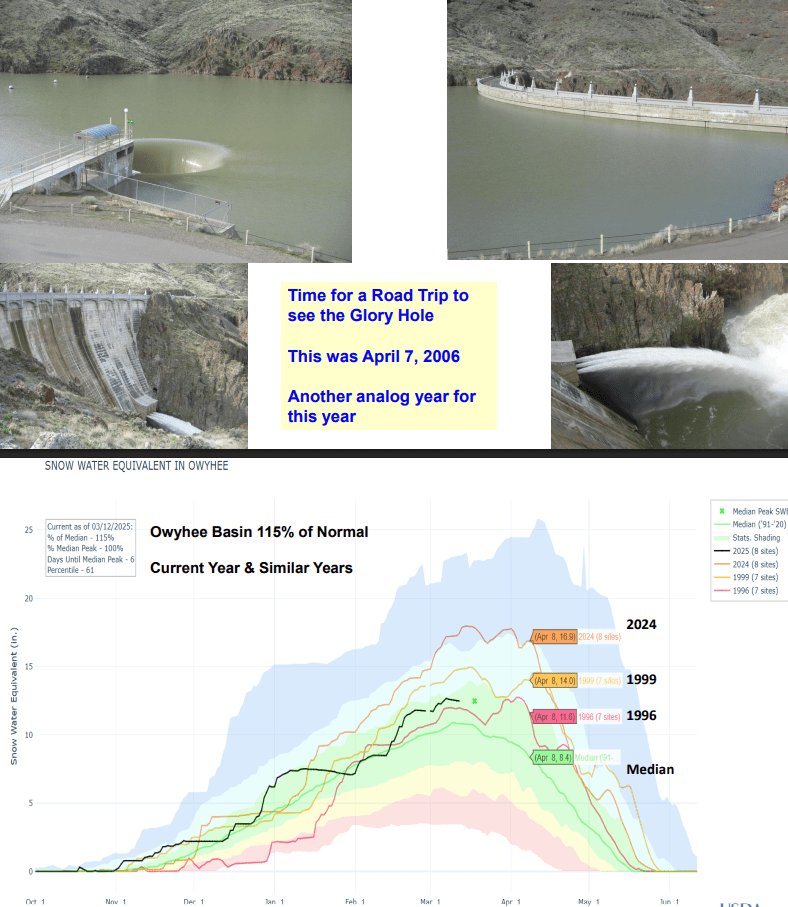
For MF, Main Salmon, Selway & Lochsa and a few more – Owyhee, Bruneau and Salmon Falls Creek. Enjoy, be safe and keep and eye on the weather and flow levels for changing conditions.
Wow – what just hit us? Here’s a summary of the key indicators I was watching leading up to this storm. Never stop learning and watching the weather to better understand what’s happening here, around us and why.
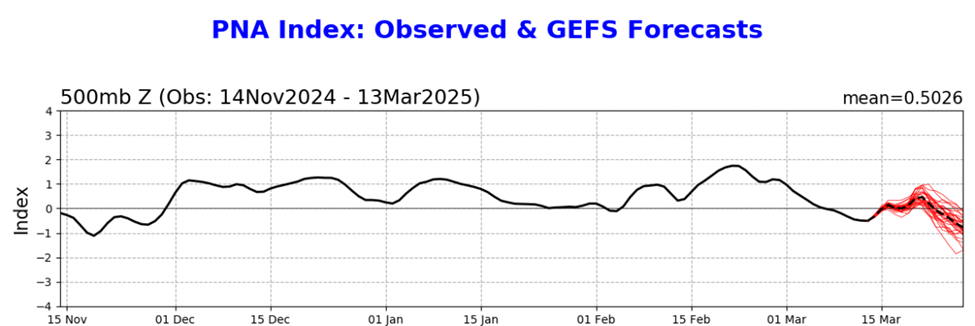
The PNA started hinting at weather system brewing back on Mar 13 with sharp decrease and biggest drop since last Nov storm. A Buoy Pop was also marked on my calendar from around same time. Always nice to see in agreement of indicators two weeks out.
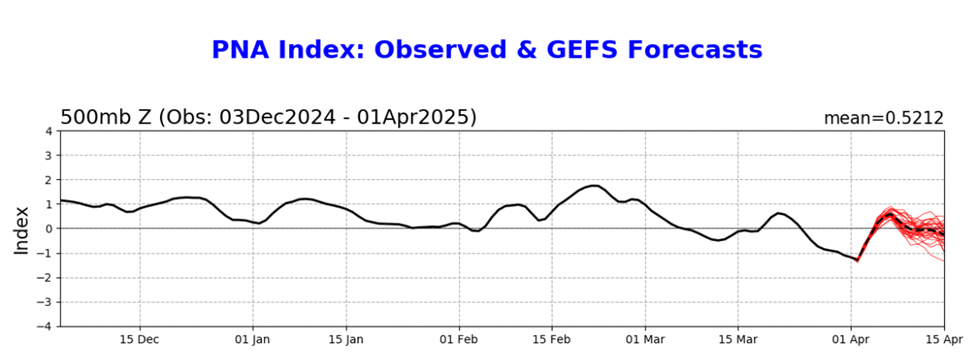
Here’s current PNA which shows the Apr 1 drop, then going positive which means return to high pressure in early April.
Severe Weather Europe from Mar 31 provides a good explanation, just need to read between the Ads. They summarize the springtime battle between winter and summer patterns fighting for the lead. This probably led to the isolated weather pattern and intense storm with 10” falling at Brundage and a couple at Bogus Monday morning followed 24 hours later with 10” at Bogus while Tamarack & Brundage received a little Tuesday morning. OpenSnow forecast weather radar nailed storm hitting Bogus early Tuesday morning and not pushing north. I should have been watching the radar loop for Brundage storm. https://www.severe-weather.eu/global-weather/april-2025-forecast-stratospheric-polar-vortex-impact-cold-air-united-states-canada-fa/
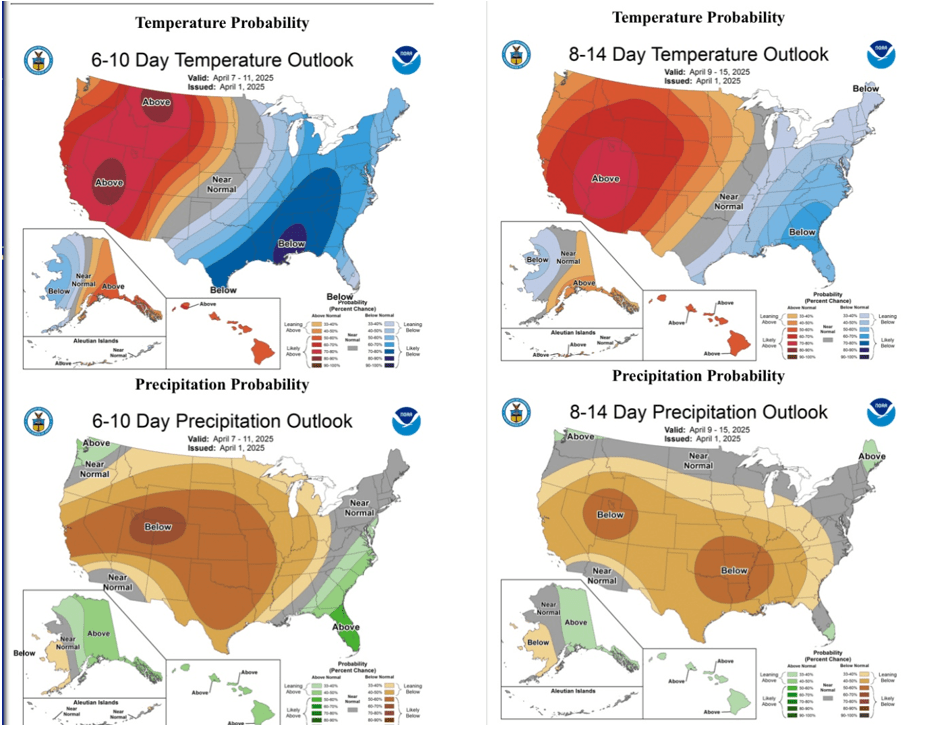
Severe Weather also provides a good summary of early April weather and why we’re gonna be warm & dry in the West and the East needs to prepare for colder and wet. Many other models are picking up intensity of this event now. Stay safe.
Spring skiing returns this weekend to Idaho’s southern resorts with freezing night temps and warm day temps. Enjoy while the nights are still freezing in the mountains.
This also means the rivers will rebound with the warmer temps. Be safe out there – a friend is on a solo trip down the Main Salmon this week.
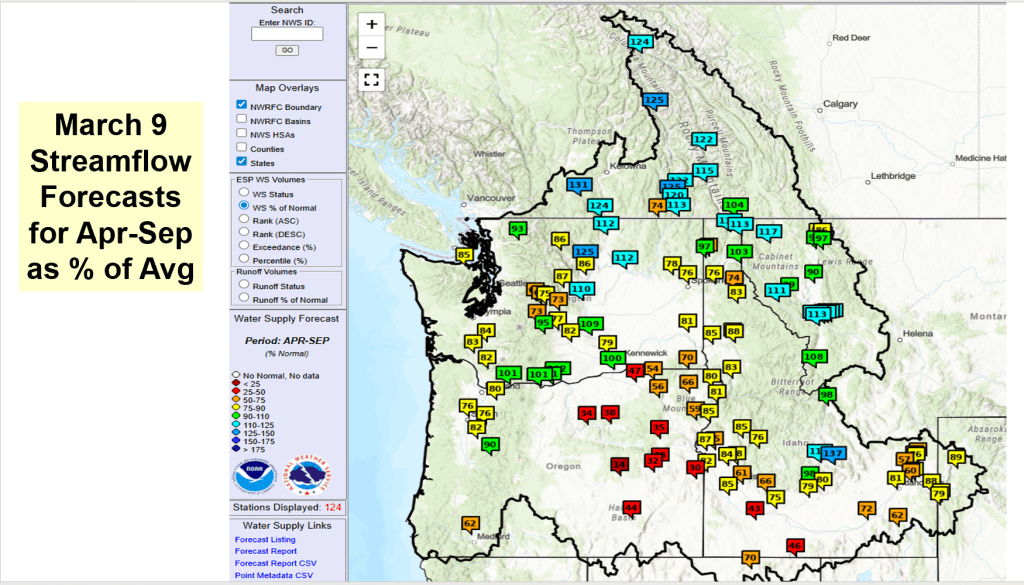
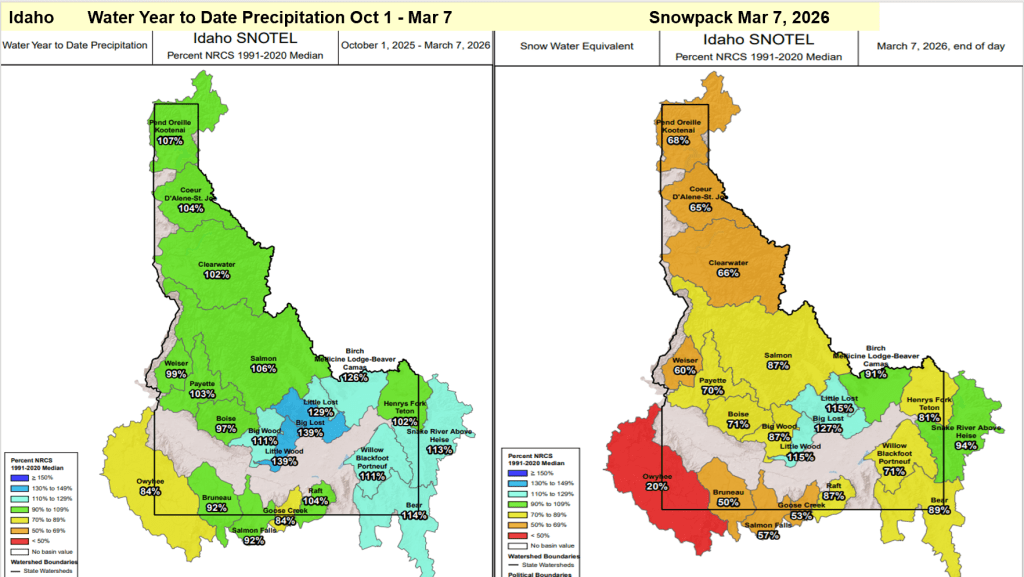
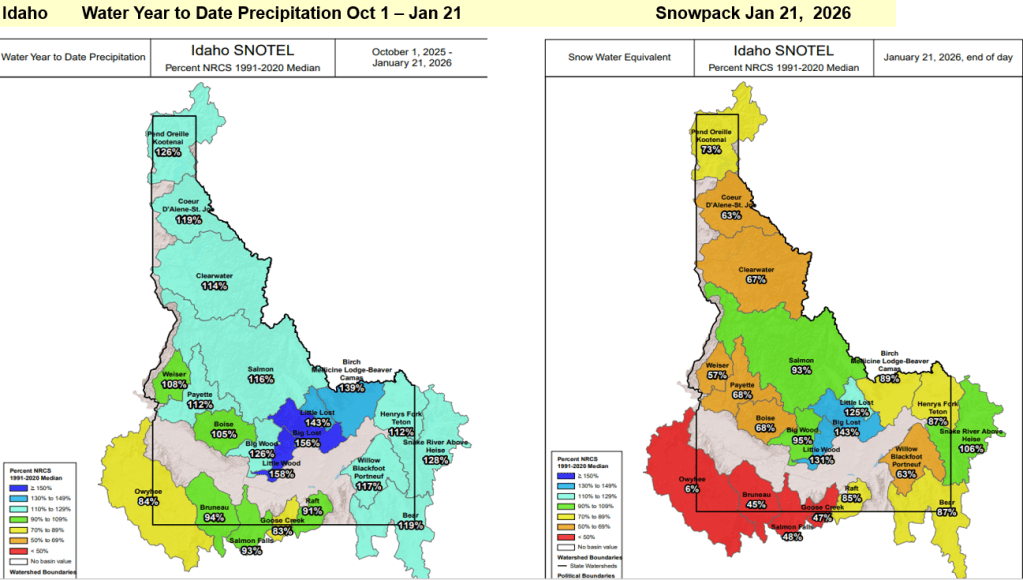
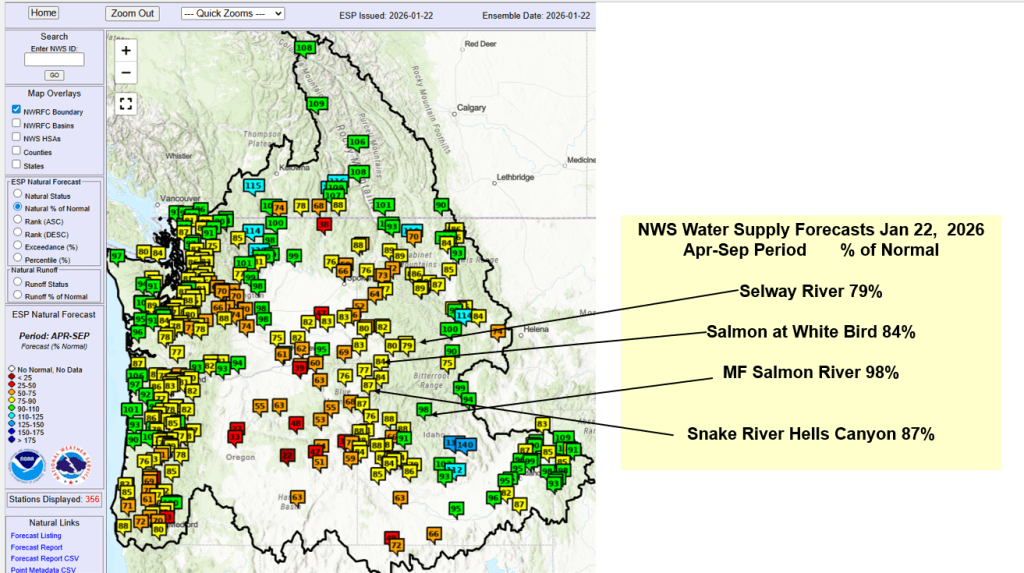
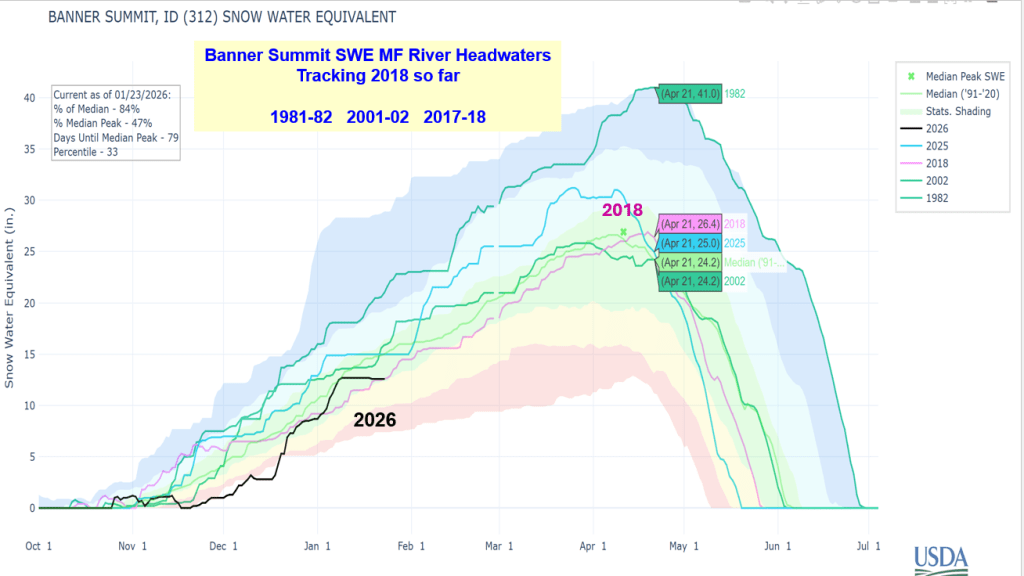
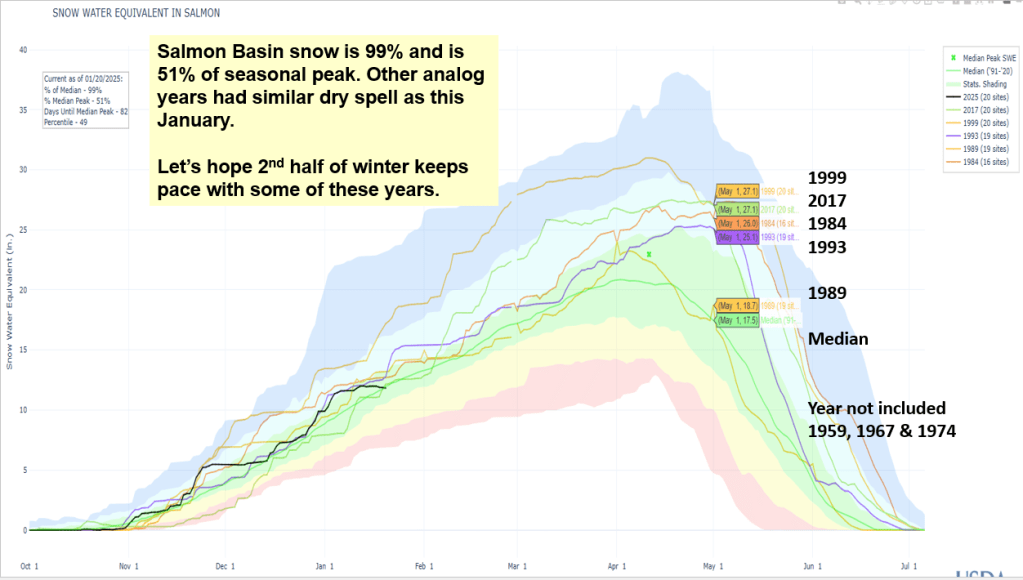
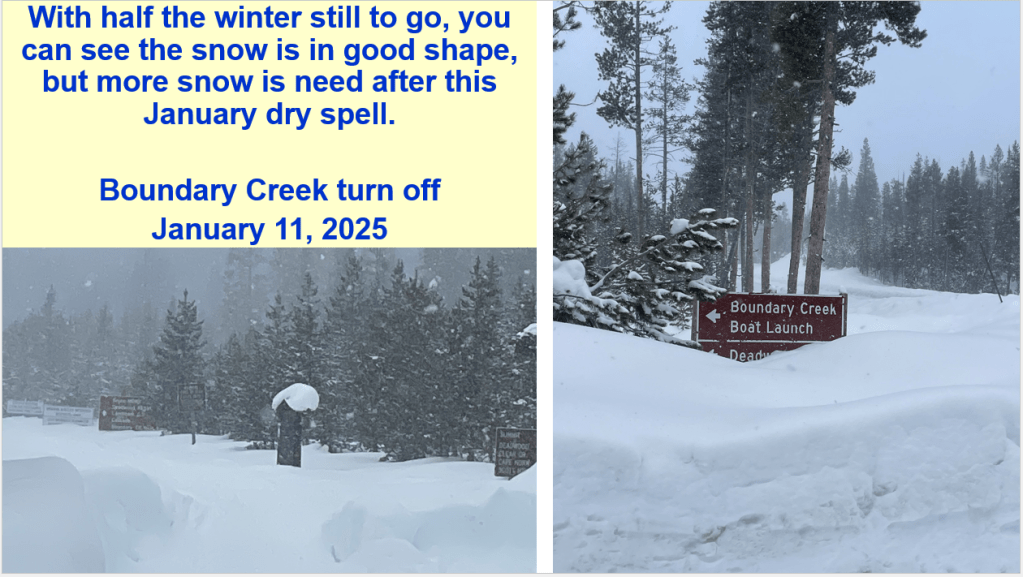
Here’s a snow & flow update for the Salmon, MF and Selway rivers and a Lochsa Bonus. Current snow conditions are displayed with analog years mentioned in previous posts. Streamflow forecast are from the NWS around Jan 20 and compared to observed runoff the analog years. January 15 is consider the half way point for winter. Overall the snow is in good shape because of the great start, but more snow is need after this dry January as show in image below.