With more snow accumulating in our mountains, let’s look at how this year compares with other years that follow Strong El Nino Years. In the past, we’ve had some good snow and flow years following Strong El Nino Years. The easiest way to explain this is – it seems the oceans and atmosphere has a lot of energy to get rid of the following year. Let’s see if we can still use the past to predict the future and how the snow is tracking.
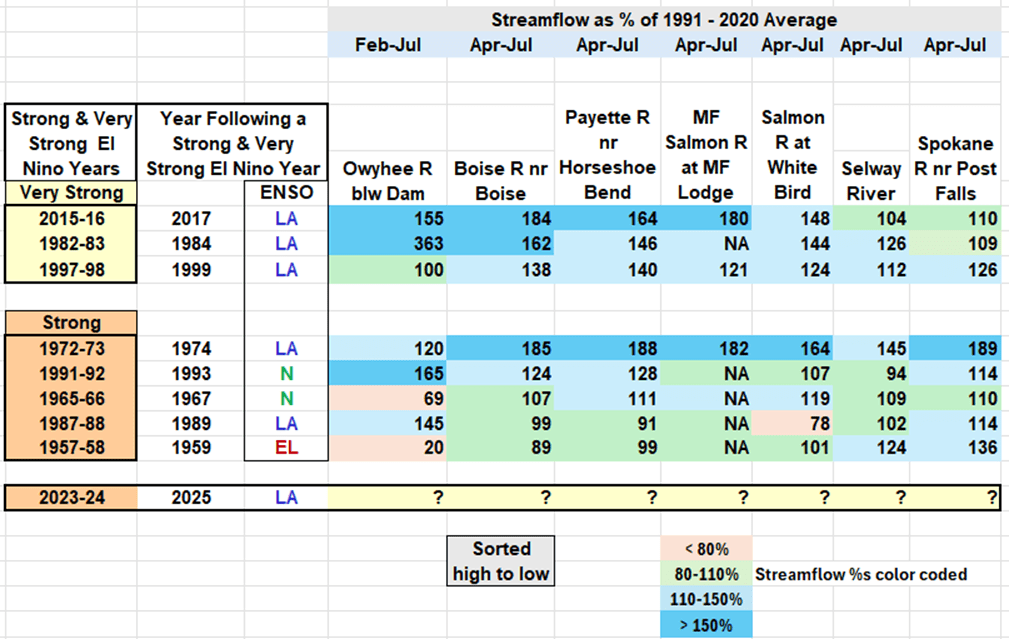
Here’s our new table of Strong and Very Strong El Nino Years and the years that follow. You can quickly see by the color shading that only a few are below 80% of average, and rest are near average, above average or outstanding with greater than 150% of average runoff.
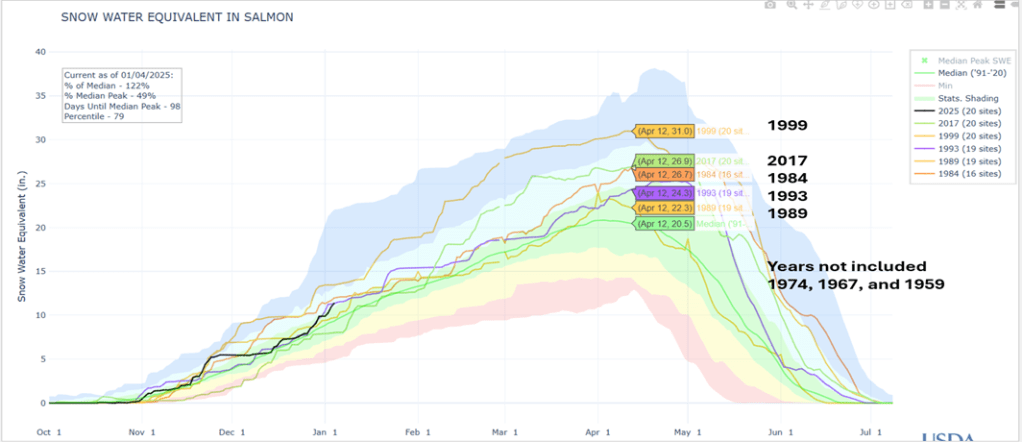
Here’s the big picture for the Salmon River. This snow index is based on about 20 SNOTEL sites. It also shows that this year, 2025, is tracking these years that follow a Strong El Nino Year.
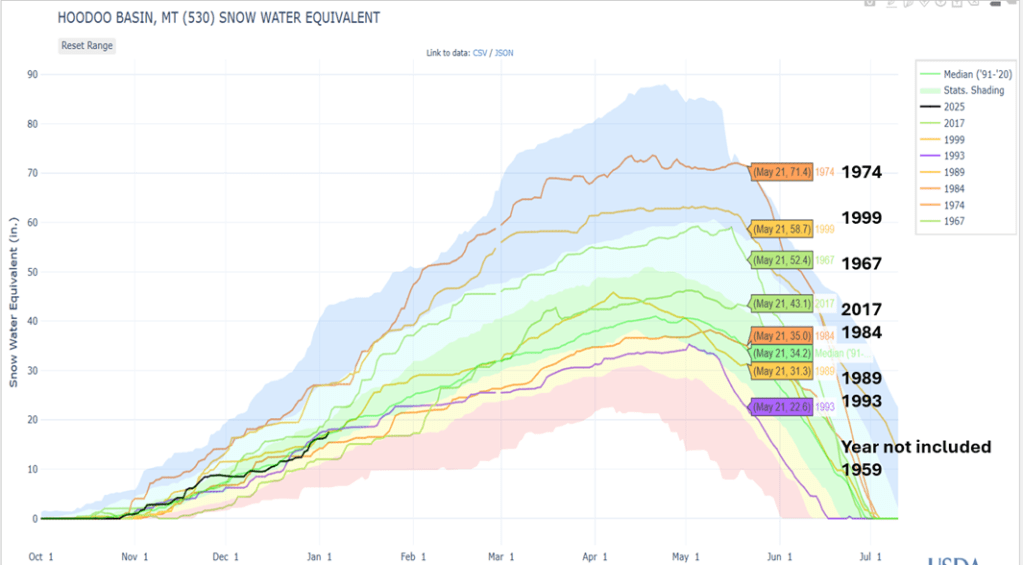
Looking at Hoodoo Basin which has daily SWE starting in 1967 also shows it was a good snow year. Interesting to note that Pete’s analog years were also 1967, 1993 and 2017 which all followed Strong El Nino Years.

“The easiest way to explain this is – it seems the oceans and atmosphere has a lot of energy to get rid of the following year.”
Is that based on any scientific evidence or is it purely speculation? Wouldn’t a greater landmass area along and near the Pacific be experiencing above normal conditions if this were true? Only area with above normal conditions is southern and central Cascades and into central ID. BC range and up into AK is below normal, as is northern Rockies of Canada and into MT. As is southern Rockies. Most of the western US and CA is below normal.
LikeLike
Good question Frosty – you’re right this relationship for year following is based on observations and living and working thru some of the stronger El Nino years. At first, I couldn’t remember if it was 1983 or 84 that had record high runoff because of back-to- back high years. It was 1983 in central Idaho and 1984 in southern Idaho. Also learned lots from similar like-minded weather watchers discussing weather conditions over breakfast for years. I started watching and learning about other strong El Nino years/patterns, 1998/99 and again in 2016/17. Even this spring, heard Death Valley Lake had water in it for first time since 1983/84 winters and this rings a bell with me because I knew 1983 was a Strong El Nino. Sometimes it seems Mother Nature repeats herself. I keep watching for additional research and forecasts for these years following Strong El Nino years but haven’t seen any.
Yes, about the land mass closest to the Pacific’s ENSO conditions having or should have a better correlation with ENSO. This is why I still like that SOI – Streamflow Collections Map in the post as it shows the NF Clearwater River has highest correlation, about 0.67. I just learned Severe Weather Europe talks a lot about ENSO relationships in Europe, but they are not as strong as here because they are so far from Pacific.
I think what you are asking about is the storm track and how it sets up in the West. I’m still learning that the warm or cold waters north of the La Nina/El Nino equator waters can deflect or determine storm direction of storms hitting the West coast. Kinda like highs and lows in atmosphere. Winter of 2017 was probably unusual as most of the West had a good snowpack. I love that one image of 43 Atmospheric Rivers pounding the West coast and wish I could find a data source from whoever counts AR every winter.
Those new west wide snow and flow maps generated from NRCS interactive map are a great way to look at the big picture. The 1967 maps and daily SWE data shows Montana as the big winner because of the late winter / spring storms following a Strong EL event. Each is going to be different, so I would not expect the whole West to benefit the year after like in 2017. I’m hoping these analog years provides us the opportunity to start watching and selecting similar years and what happened sooner rather than waiting until April peak SWE. This wither it seems we are battling the Polar Vortex pushing south and east of the Continental Divide which is blocking western storms.
I like your style to look at the big western picture. I tend to focus on Idaho’s snow and water. Bogus Basin’s snow depth is having best start since 2011, top 5 since 2000, and in top 10 since 1944. I think challenge in Washington’s northern Cascades is they are still waiting for first winter freeze in the Seattle area, which means maybe more rain. I haven’t looked at the seasonal precipitation, way more fun watching snow accumulate.
With half the winter still to come, and this dry western weather here till maybe end of January, let’s keep watching this winter to see where snow accumulates or not. Here’s the current western snowpack from another talk that I’ll post this week that you might like. Thanks for the question and hope I answered it !
LikeLike
https://nwcc-apps.sc.egov.usda.gov/imap/#version=169&elements=&networks=!MSNT&states=!&basins=!&hucs=&minElevation=&maxElevation=&elementSelectType=any&activeOnly=true&activeForecastPointsOnly=false&hucLabels=false&hucIdLabels=false&hucParameterLabels=true&stationLabels=&overlays=&hucOverlays=state&basinOpacity=75&basinNoDataOpacity=0&basemapOpacity=100&maskOpacity=100&mode=data&openSections=dataElement,parameter,date,basin,options,elements,location,networks,baseMaps,overlays,labels&controlsOpen=true&popup=&popupMulti=&popupBasin=&base=esriWsr&displayType=basin&basinType=6&dataElement=WTEQ&depth=-8¶meter=PCTMED&frequency=DAILY&duration=I&customDuration=&dayPart=E&monthPart=B&forecastPubDay=1&forecastExceedance=50&useMixedPast=true&seqColor=1&divColor=7&scaleType=D&scaleMin=&scaleMax=&referencePeriodType=fixed&referenceBegin=1991&referenceEnd=2020&minimumYears=20&hucAssociations=true&relativeDate=-1&lat=43.241&lon=-105.285&zoom=5.2&autoExport=full,pdf,2,2,P,BL,Westwide%20SNOTEL,53.1005,29.8803,-100.0054,-127.0528
LikeLike