Best Start to Winter Since…

Now to answer the question everyone has been asking… This is the best start at Bogus since 2002 and best at Brundage since 2015! This analysis is based on Dec 15 snow data. Keep in mind Bogus’s daily SNOTEL record starts in water year 2000 and Brundage in 1986. Snow depth sensors were in installed in late 90s early 2000s.

Comparison years may change to the better with more storms coming next week and before the new year starts! Here’s the details and forecasts follows…

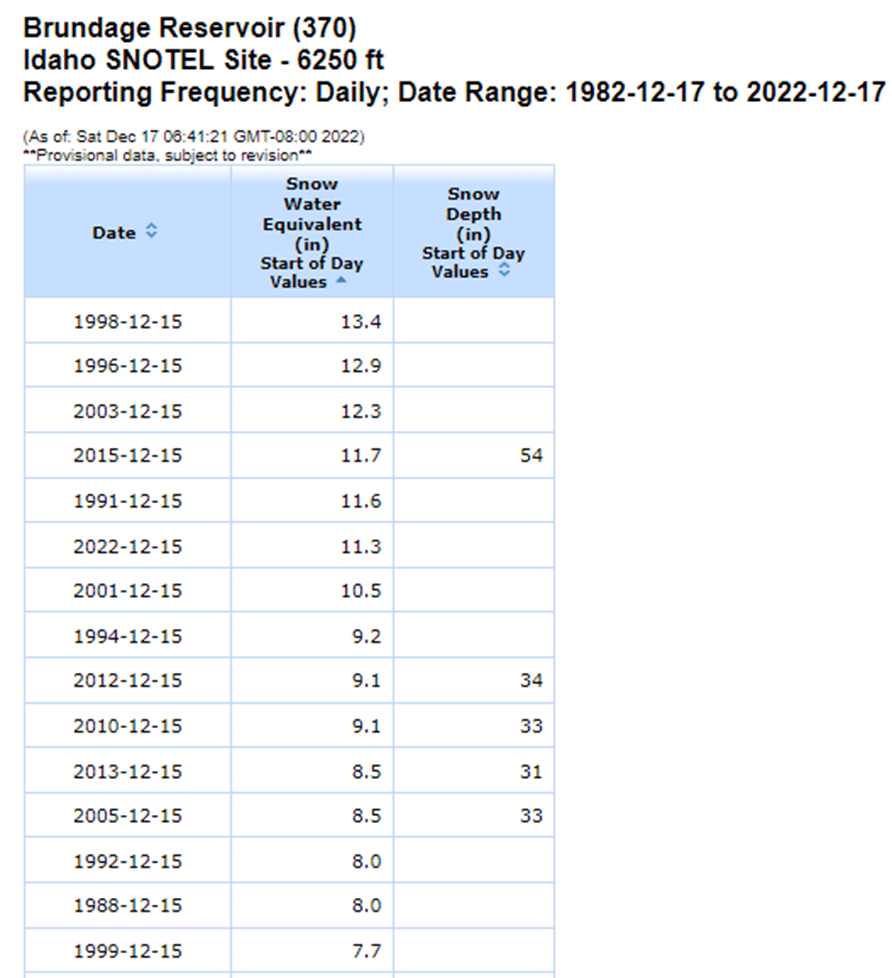
Below are Bogus & Brundage Dec 15 Snow Water Equivalent (SWE) values sorted high to low. Snow depths are included if the depth sensor was installed in that year.

Bogus Basin’s Dec 15 SWE & Depth are 10.0” and 46”, highest since Dec 15, 2001 when there was 15.0” of SWE with depth of 61”. Wow, that was good year!

Keep in mind the water year is the year designated in graphs below and runs from Oct 1 to Sep 30. So this water year is for the winter of 2022-2023 and is called water year 2023.

Brundage Reservoir SNOTEL site on Dec 15 had a SWE of 11.5″ with an estimated 45″ of snow depth, best since 2015 and 6th highest since records start in 1986. Top 5 years with more SWE on Dec 15, in order, are 1998, 1996, 2003, 2015 and 1991 followed by 2022.  Remember those good wet snowy cold years in the mid to late 90s.

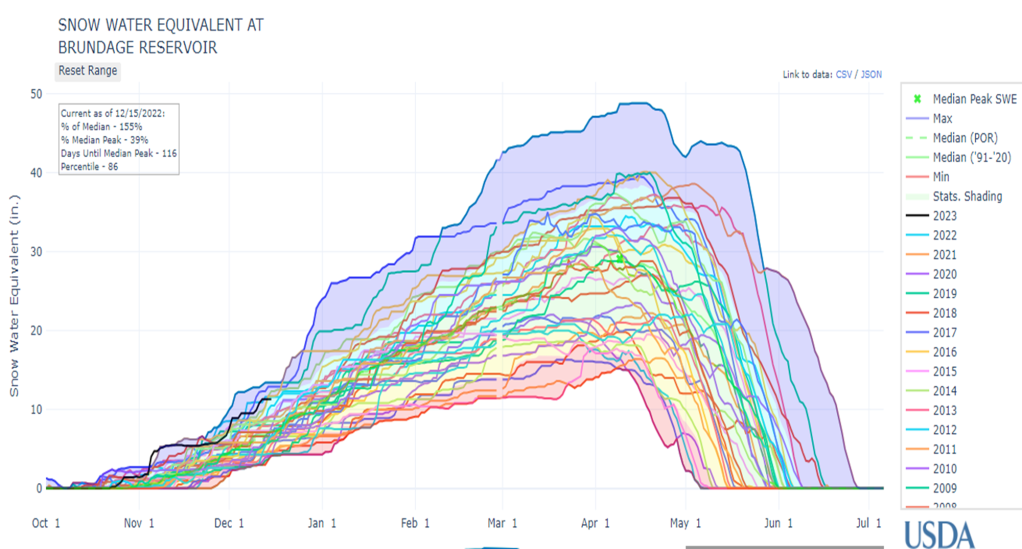
Busy but interesting graph above showing the SWE for all Bogus Basin years for the winter accumulation and melt season.

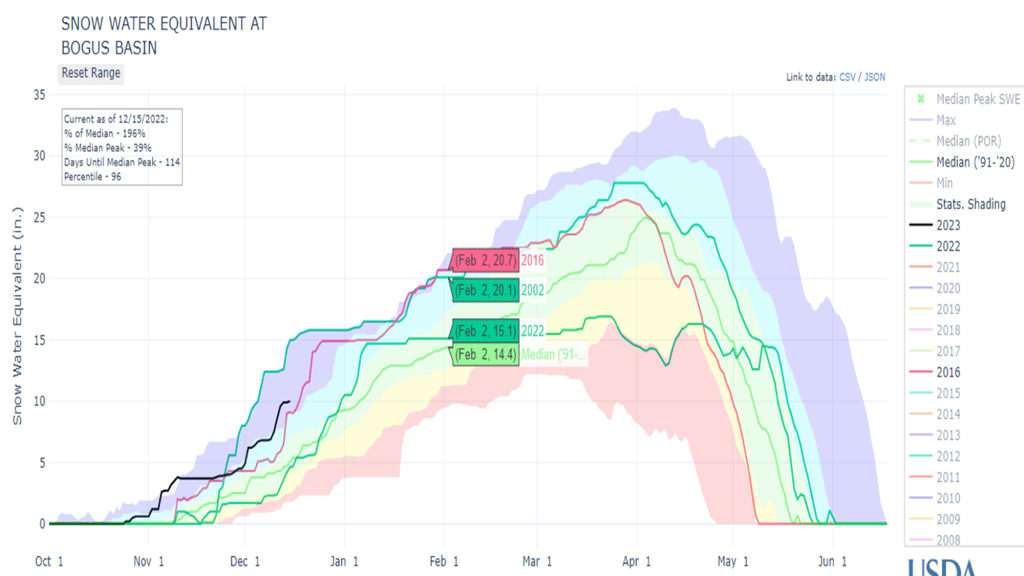
Bogus Basin time series SWE graph below shows 2002 with highest SWE on Dec 15 and this year, 2023 in black, with a little less and a bit more than 2016. Last year, 2022, is included to see how flat (dry) the SWE line was after Jan 1 and until the the wet weather returned in March/April to push the melt out later than normal. This means you should ski now and don’t wait for next Pow day. It is always interesting to see how close the SWE lines are in January for the different years and how what happens in January typically to determines the outcome trends for rest of winter. Later, we’ll talk more on last year’s dry Jan & Feb spell that also bled into March and if this is likely to happen again this year.

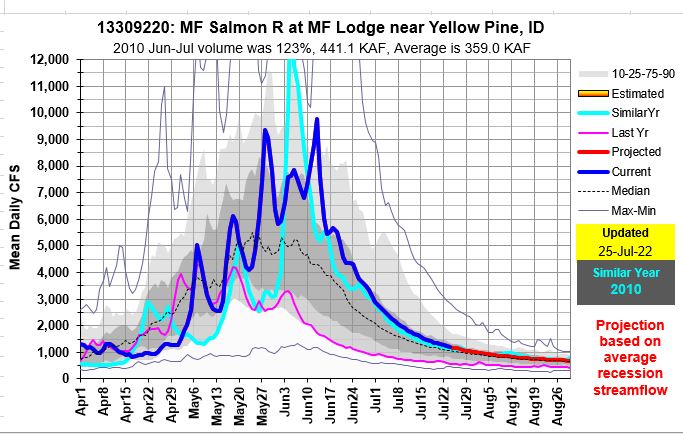
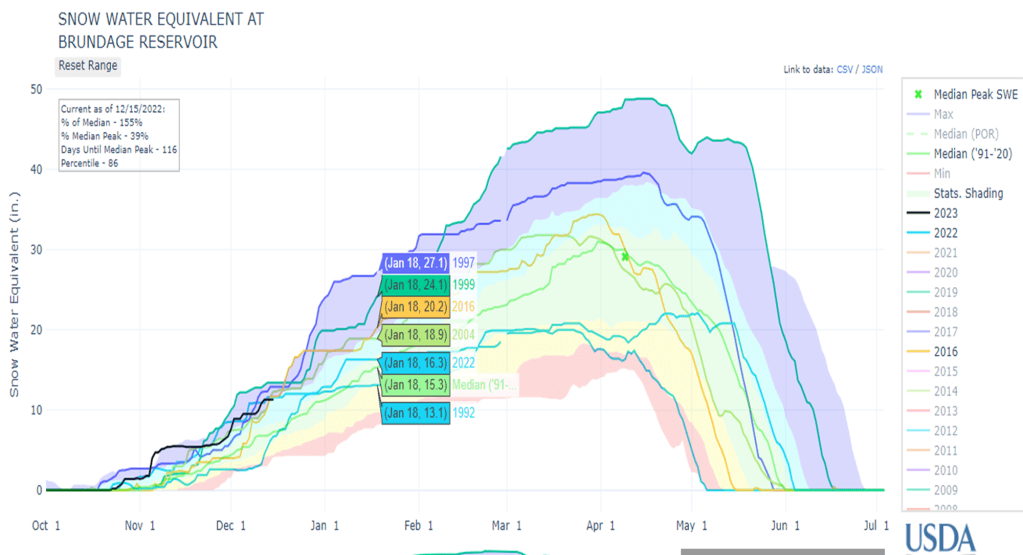
Similar with Brundage Reservoir you can see this year’s SWE, 2023 in black, is 6th highest with higher Dec 15 amounts in 1998, 1996, 2003, 2015 and 1991. These are actually Water Years – 1999, 1997, 2004, 2016, 1992 and 2023 this year.

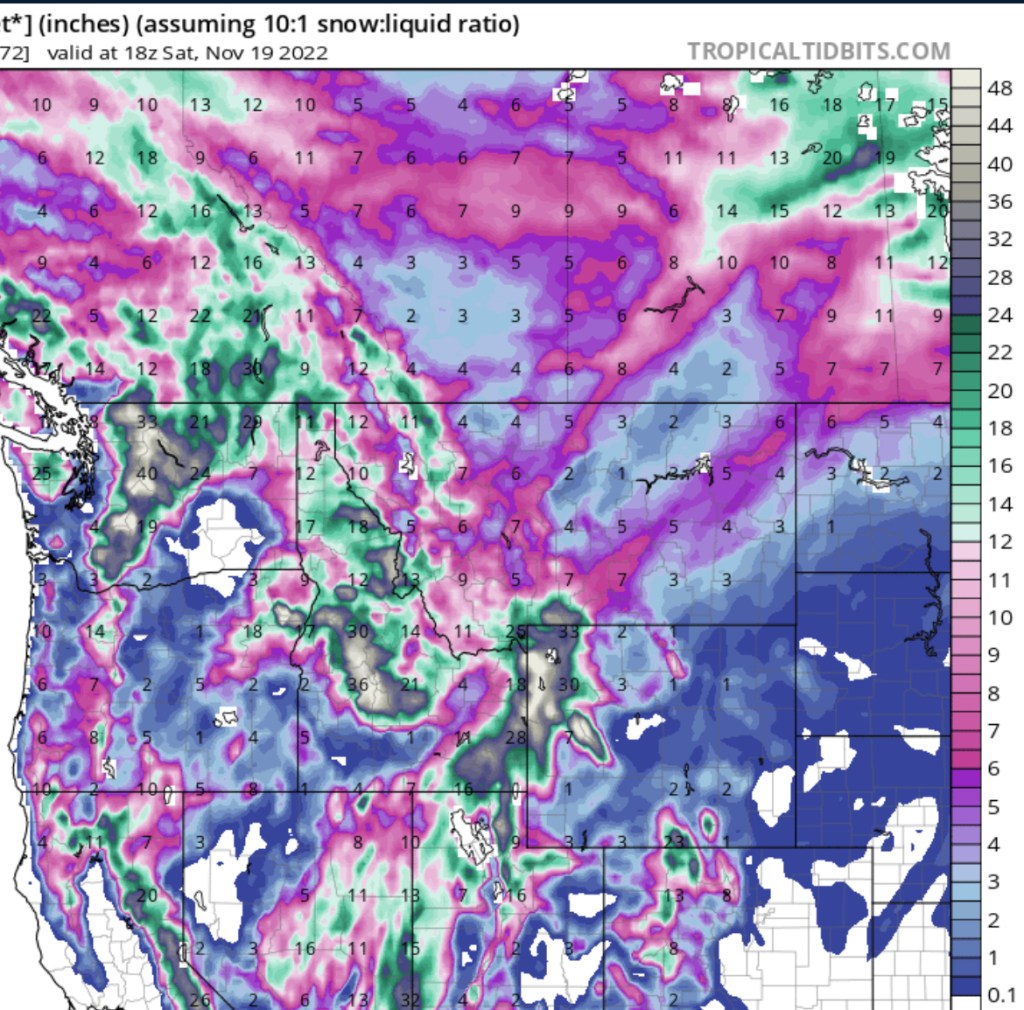
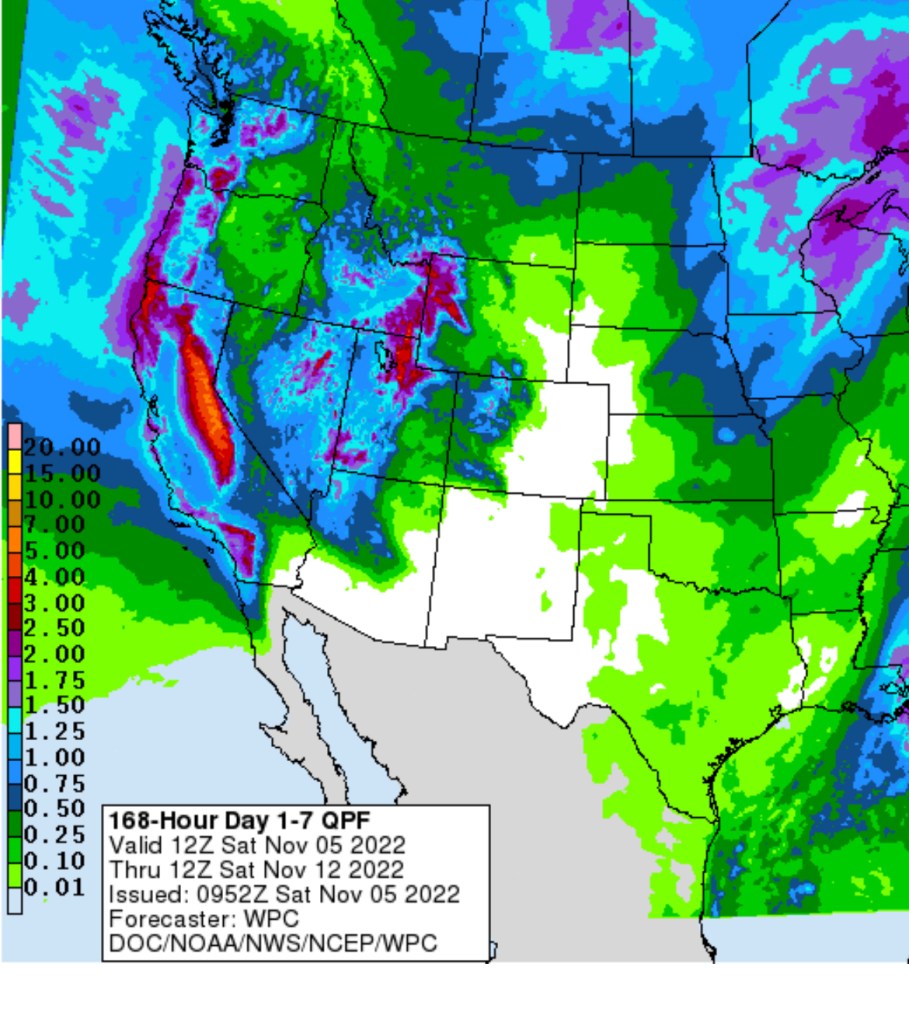
With a break between storms of blue skies and cold temps, it’s time tune & wax those boards for when the moisture returns. These two 7-day precipitation forecasts show more moisture coming the 2nd 7-days. Lets hope it stays on the radar for Santa’s arrival and beyond.

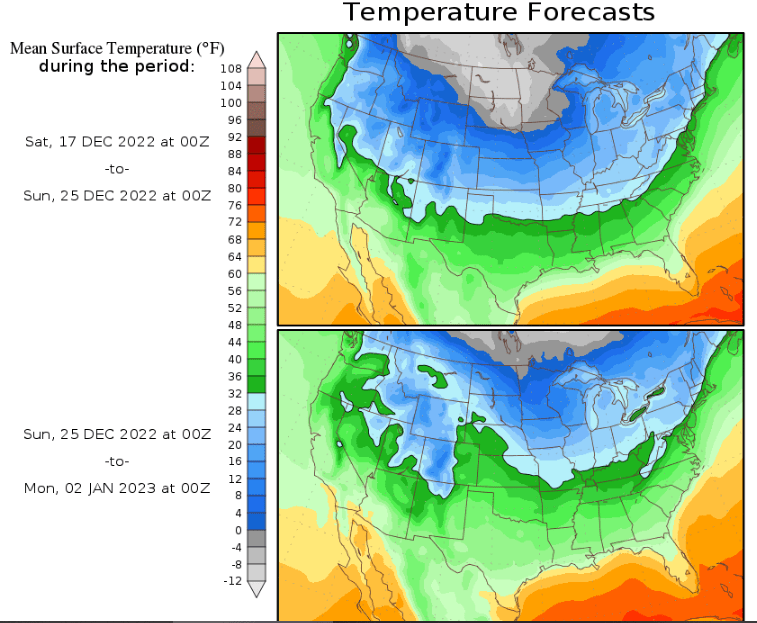
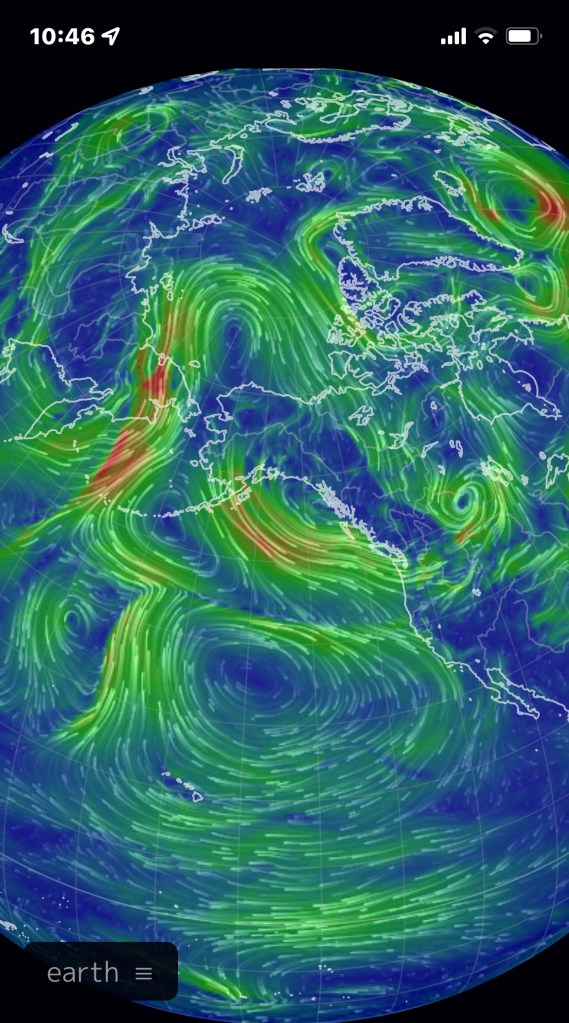
Top temp map shows cold temps upon us now with 7-day average temps averaging -12F in the mid-west and less cold the 2nd week, Dec 25-Jan 2. Remember cold is good, don’t let anyone kid you.

For the many years/decades I’ve been watching these 7-day forecasts, its interesting to point out that this 7-day temp anomaly for Dec 17-25 is one of the first times that I have seen so much blue & white and so little red that signifies above average temps. Cold is good.

Thanks for reading and if still looking for a stocking stuffer – check out Airflare. An inexpensive phone wilderness rescue app that can be used by rescuers to determine your exact location. https://airflare.com/

Wondering why so cold, me too. Here’s one reason that may be driving this winter’s weather…

If the Hunga Tonga volcano went off above ground, we’d still be talking about it !

Lisa L – this is probably reason you got meters of rain in the land down under. Was it colder and more humid than normal too?

1st time for me cutting grass and mulching leaves with snow on the ground and leaves on the trees ! Meg R – There’s still time to cut your grass short to make snow look deeper this winter !

Any dendrologists out there know how the cold nights temps near 20F will impact trees that haven’t shed their leaves yet ? Moisture /sap freezing in trees – remember a few years ago the Nov cold spell that spilled over from Lost Trail Pass ID/MT went up the Salmon basin and deposited temps near 10F in the Treasure Valley? MF River froze over night and temps killed many red /cherry trees in town…

Here’s a long article explaining impacts of Hunga Tonga volcano Jan 15 2022 and the water vapor now circulating the Southern Hemisphere. Key is under the relationship between the south and the north atmospheres. I clipped the highlights if you don’t like all the ads… You’re welcome !!!

A significant cooling event continues in the Stratosphere due to the large Water Vapor cloud, but can it impact the upcoming Winter Season?

By Author Andrej Flis

Posted on Published: 14/11/2022

Categories Global weather

https://www.severe-weather.eu/global-weather/stratosphere-polar-vortex-cooling-event-update-cold-anomaly-winter-season-influence-fa/?fbclid=IwAR1gKqN0Rn7rwIEGet_9r5q2ugWWTpk1JzewCGMklTPKQVeWc0W4aax1TmQ

Ahh so many benefits from one storm…

•Increase soil moisture to improve next year’s runoff.

•Increase streamflow levels from their summer/fall lows – actual low point was mid-Oct, but I didn’t save image.

•Start accumulation of mountain snowpack.

•Fish, farmers, hydropower, skiers, winter tire sales… who’s not gonna benefit from this first of many winter storms ?

1st AR moving in

https://cliffmass.blogspot.com/2022/11/warm-and-very-wet-before-snow-and-cold.html?m=1

Fall low flow levels reflect dry fall.
Typical blow normal statewide streamflow levels.
Let it snow !
Next 7 days above look wetter especially along ID/WY border then drying out for 2nd week below.

Interesting Pacific surface winds. https://earth.nullschool.net/?fbclid=IwAR1suej3Lwq8RkobH60bx7mdCIUgnRdZhJdwxCgRXxQC7ZDXCuzf0xCepRI#current/wind/isobaric/850hPa/orthographic=-144.42,51.88,331

Long Fall & Siberian Snow Cover

This has got to be one of the longest, driest falls in a while in the PNW and hot in Seattle!

All good things must end as winter arrives this weekend. While we’ve been enjoying fall colors with little wind that extended Nature’s Fall show, the winter stage was being set in Siberian with a currently an above normal snow cover area.

A good Siberian snow cover in Oct/Nov influences the jet stream across the US/Can border from PNW to Great Lakes region and Europe. Time will tell where the jet stream will cross the border, but several storms with colder temps and snow have already arrived in the Great Lakes Region. 

This weekend, snow will fall down to 4000 ft. in central Idaho and more next week. Stay tuned as we ride in on a 3-peat of La Niña winters. More to follow as we review last year’s analog years and forecasts with what happened and end with this winter’s analog years.

Fall pics from Glacier NP – October 17, 2022. 

Here’s a few images to illustrate how dry and hot September & October have been.

Sept 1-Oct 18 % of average precipitation. Red is 0 to 10% of normal precipitation.
Oct 1-18 inches of precipitation – zero for most of West. 
Sept daily mean temps 3 to 7F above normal.
Oct 1-18 daily mean temps 7 to 15 above normal in PNW. Bring on winter !!

For those who like details, here’s a long wordy article explaining the Siberian snow cover relationship, and more… or hang tight as we get ready for winter to enjoy the ride!!!

https://www.severe-weather.eu/global-weather/polar-vortex-winter-weather-snow-cover-influence-forecast-united-states-canada-europe-fa/

Rain & Flow info for Hurricane Fiona in Puerto Rico…

I’m sure you’ve seen the videos of hurricane Fiona in Puerto Rico… here’s some of the rain & flow data to better visualize the impacts of this storm. 

Rain -> 16” in 1.5 days at this rain gage. 

Flow – river increased from 150 cfs to 83,000 cfs in half a day. Watershed is only 120 sq miles. Gage sits 13’ above sea level.

2017 Hurricane Maria had more rain to produce a peak flow of 68,300 cfs, 3rd highest peak in 49 years of data.

Highest peak flow recorded was 128,000 cfs, September 16, 1975 from Hurricane Eloise in a 120 square mile watershed ! Wow!

Annual peak flow since gage was installed in 1975.

Salmon River Flow Projection

Looking at average flows. Very similar to 2012 and much better than last year, 2021. With the dry summer weather here, and I have not seen any indicators that precipitation will change to wetter or even normal. Expect this year to drop faster than 2012 until late summer rain occur or cooler temperatures arrive to reduced water up take by vegetation. You can see the long term average trying to increase in September.

Buffalo Fork – the last to reach its snowmelt peak in Upper Snake & more flow graphs…

You know the snowmelt streamflow peak flows have occurred in the Upper Snake when the Buffalo Fork peaks. This means we’re on the downhill side of the streamflow hydrograph – not just in Upper Snake but probably across the whole state. The Buffalo Fork is typically the last tributary in the Upper Snake to reach its snowmelt peak. Buffalo Fork is holding steady and flowing right at its long term average. Thanks Lyle Swank for teaching me this relationship!

Peaks flows where amazing this year and occurred in all shapes and sizes depending upon snow, spring rain and air temps. Here’s a quick summary of them: the early one – Owyhee. Bookend peaks – Salmon Falls. Flashy pointed peaks – Big Lost & Big Wood. Rivers that remained high and kept pushing water out from their sources – MF, Salmon, Selway, Lochsa. And the late ones – Snake at Jackson and Teton, but when compared to historic average, they were timely.

Following graphs show current year flow, last year and similar year to illustrate summer flow trends. Using the past years to predict the future still works when you are on the downhill side of the hydrograph.

A March peak with good flows and blue skies!
The Bruneau provided for those able to time it!
DOA – Day of Allocation for natural flow/reservoir water users. Cool recession flow relationship illustrating that when the flow recedes to 2200 cfs is typically when DOA, happening now. Much better than the prediction from early April for June 20. Thanks Becca Garst for the analysis!

Decision Time for the Colorado and Snake Rivers

Here are the highlights or lowlights for some major decisions to be made…

It’s Now or Never for the Columbia and Snake River Basin’s Wild Steelhead

The last decade (2011–2020) has been the worst average on record for steelhead returns in the Columbia and still managed to average around 200,000 fish per year. (The last five years have been especially awful, and pulled the average down considerably.) The previous decade, 2001–2010, one of the best on record, averaged more than twice as many. Anglers who were fishing those years will tell you how good it was. In 2001, an astounding 633,000 steelhead passed Bonneville. Of those, nearly 150,000 were unclipped fish. We are a far, far cry from those kinds of numbers right now.

Now Or Never

In late October, the Wild Steelhead Coalition released a three-chapter online campaign called “Wild Steelhead: Now or Never” in celebration of our 20th anniversary. “Now or Never” is a report on the state of steelhead populations, the causes for declines, and investments required to restore populations, and, most importantly, a call for steelhead anglers and the outdoor industry to use our political and economic power to demand that natural resource agencies and elected leaders make the changes required to restore wild steelhead and their home waters before it is too late…

https://www.flyfisherman.com/editorial/its-now-or-never-for-the-columbia-and-snake-river-basin-s-wild-steelhead/459666?fbclid=IwAR0TesN6VNP6paQttgPrQLFAj7o9w2TnCVfvqXylE17aSZzoZxhK6Aktpqg

Big Colorado River water cuts needed next year…

The largest single batch of water-use cuts ever carried out on the Colorado River is needed in 2023 to keep Lakes Mead and Powell from falling to critically low levels, the U.S. Bureau of Reclamation commissioner told a congressional hearing Tuesday.

Between 2 million and 4 million acre-feet of water use must be cut for 2023 across the river basin to cope with continued declines in reservoir levels…

“Eighty percent of Colorado River water is used for agriculture and 80% of that is used for forage crops like alfalfa. I’m not saying farmers should stop farming, but that they carefully consider crop selections and make investments to improve efficiency. By reducing their use of Colorado River water, agricultural entities will be protecting their own interest,” Entsminger said.

https://tucson.com/news/local/big-colorado-river-water-cuts-needed-next-year-top-us-official-warns/article_90566a38-ec37-11ec-bc3d-63579bae83c6.html

MF Salmon and Selway Rivers Recession Flow Estimation Tool for use after peak flows have occurred and river is in full recession

Did you get lucky and get a permit for the MF or Selway Rivers? Here’s a tool developed a while ago by Peter Palmer, Ron and crew, and it still works. Because Mother Nature melts the mountain snowpack that feeds the streams consistently (elevation, south and north facing slopes, and even burnt areas) from one year to another, the end result is snowmelt recession flows are consistent from year to year. Try using the graph to see what the flow might be on your future launch date to better understand potential river flow levels while also considering your risk level and boating skills.

It is designed to be used after the peak flow has occurred AND the river is in full recession. This is OBSERVED by watching the decreasing flow levels on the recession side of the hydrograph. If there is a future river peak from rain or additional snowmelt, just start over when the river starts receding again. The data used to develop the nice sloping curve is based only on when river flows were receding.

Give it a try and let us know how it worked to help predict your flow level on your launch date. These could also be helpful on other rivers to help monitor water right Day of Allocations, water right cut dates, critical low flow and more because of these consistent snowmelt / recession flow relationships that occur every year based on how the snow melts.

These two hydrographs show the MF Salmon and Selway Rivers ARE NOT in full recession because the current flow is holding steady or increasing from the warmer temperatures and /or remaining snow. The previous fast decrease in flow was a result of cooler air temperatures slowing melt and not because of the higher elevation snow that feeds the streams gradually being depleted. It is always cool to watch the diurnal snowmelt fluctuations each day as temperatures warm during the day and cool at night and impacts of as major cold fronts move through. This could be another post about what the timing of these daily diurnal snowmelt peaks really mean.