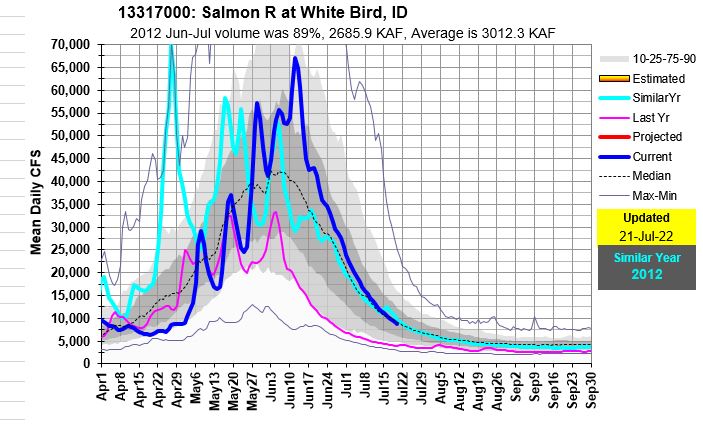
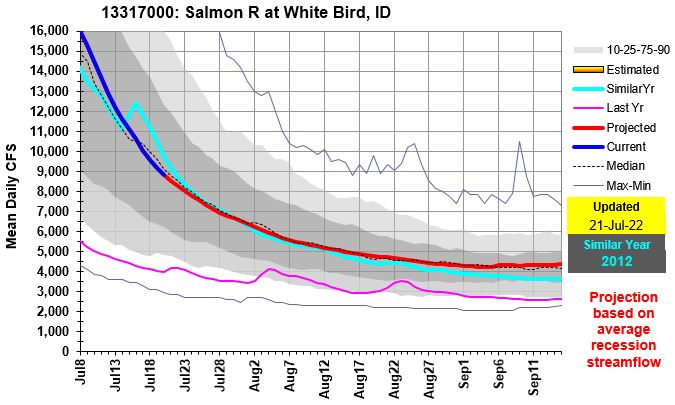
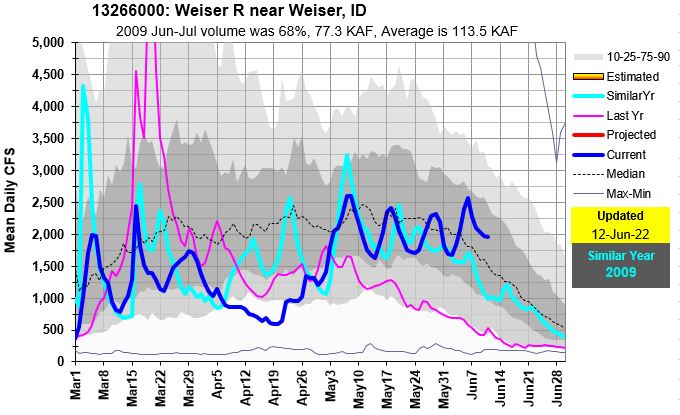
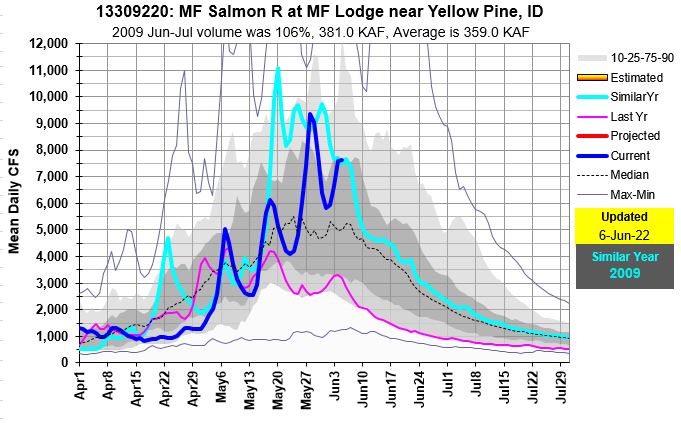
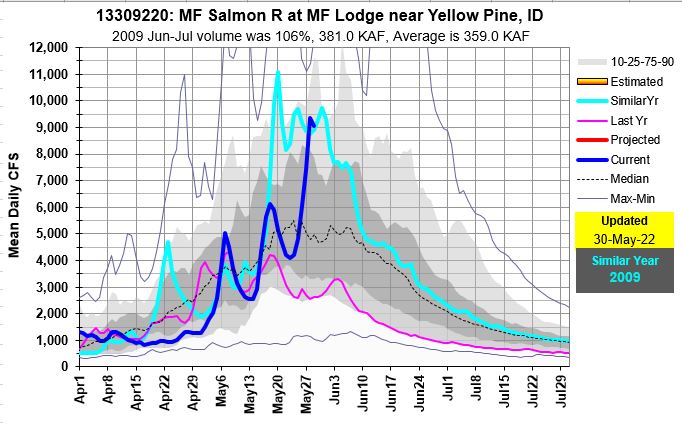
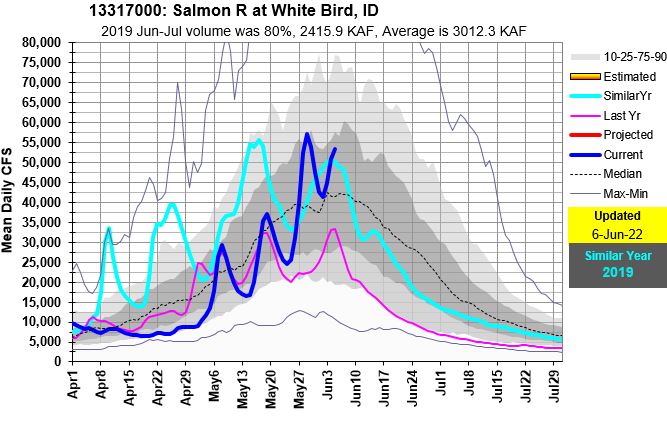
Looking at average flows. Very similar to 2012 and much better than last year, 2021. With the dry summer weather here, and I have not seen any indicators that precipitation will change to wetter or even normal. Expect this year to drop faster than 2012 until late summer rain occur or cooler temperatures arrive to reduced water up take by vegetation. You can see the long term average trying to increase in September.
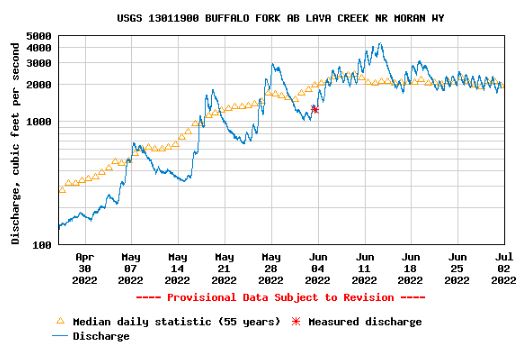
You know the snowmelt streamflow peak flows have occurred in the Upper Snake when the Buffalo Fork peaks. This means we’re on the downhill side of the streamflow hydrograph – not just in Upper Snake but probably across the whole state. The Buffalo Fork is typically the last tributary in the Upper Snake to reach its snowmelt peak. Buffalo Fork is holding steady and flowing right at its long term average. Thanks Lyle Swank for teaching me this relationship!
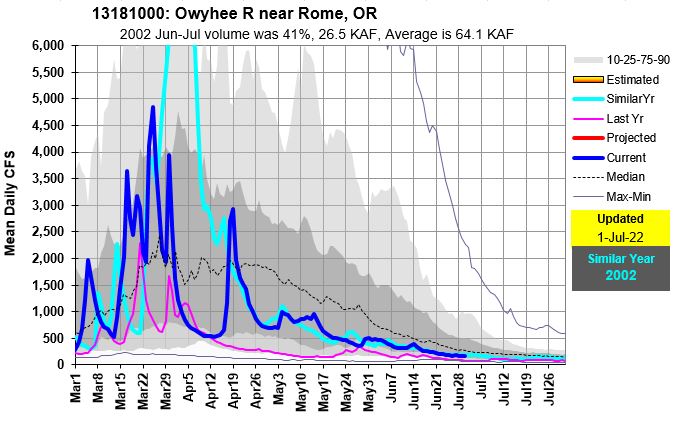
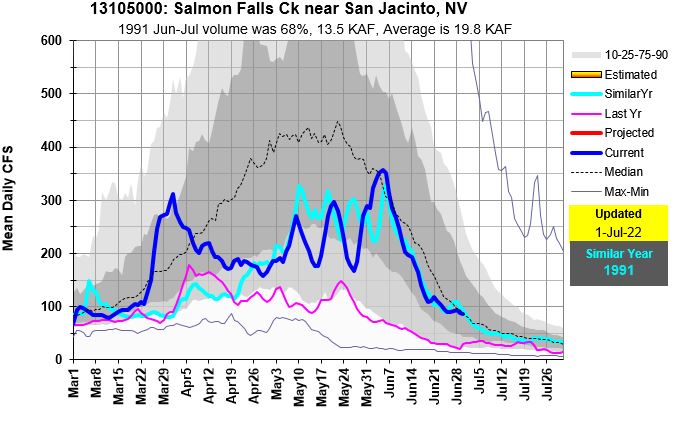
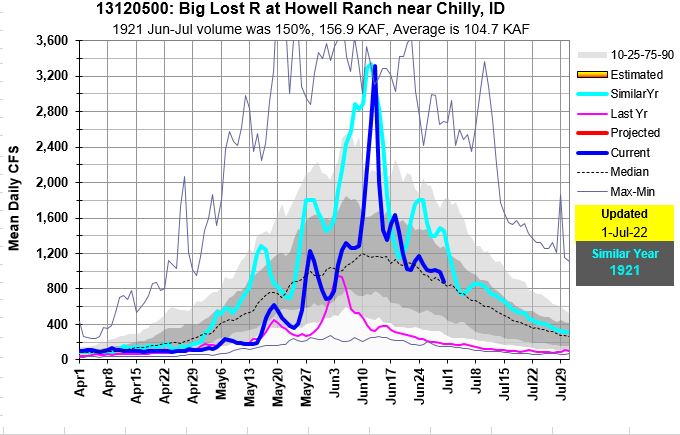
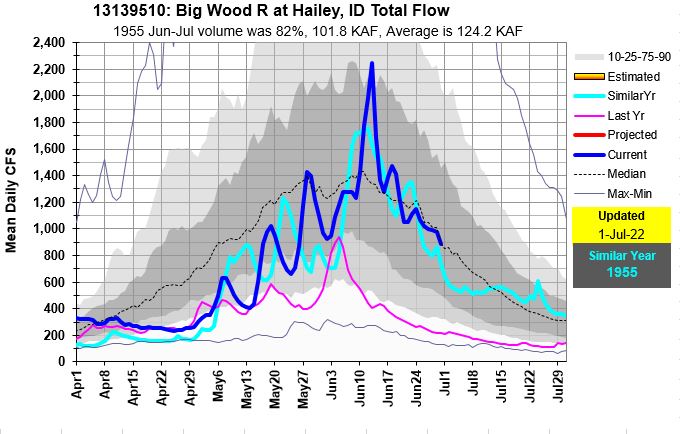
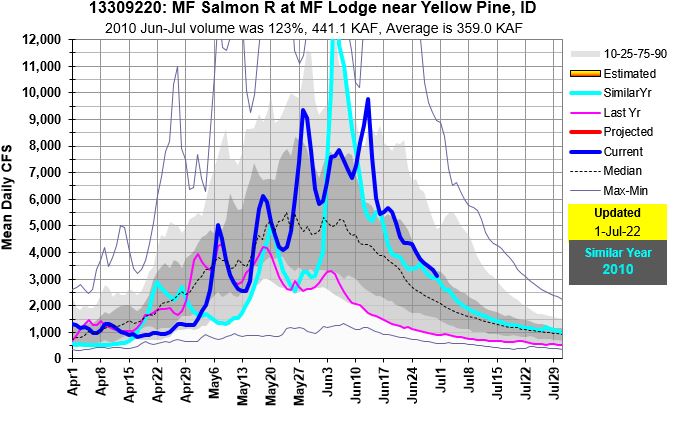
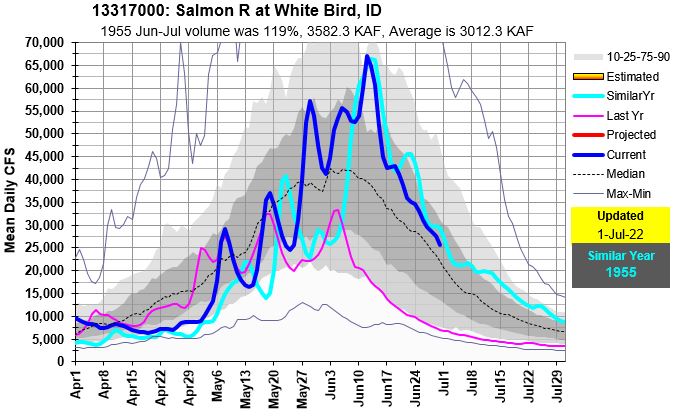
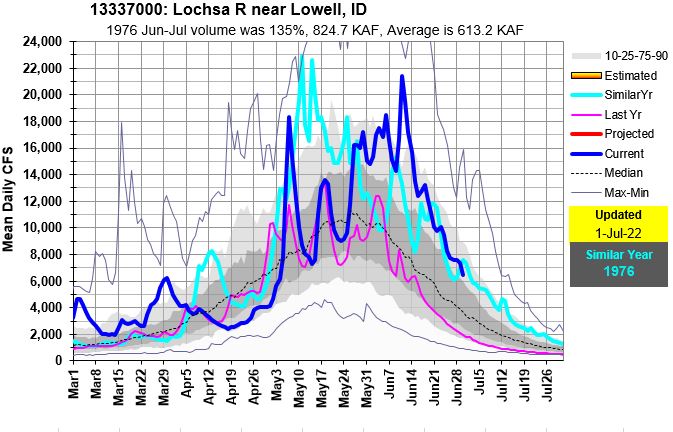
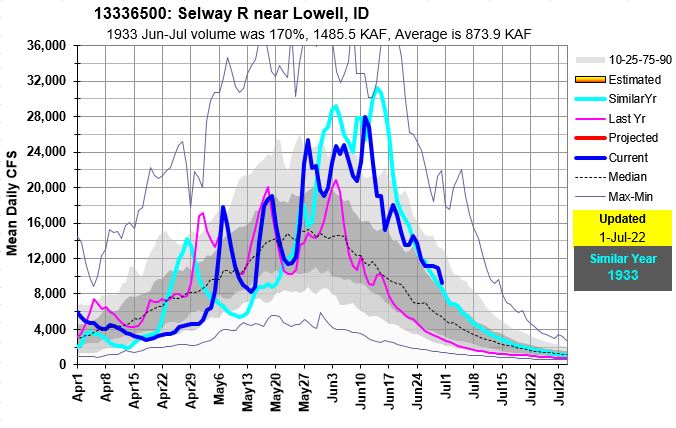
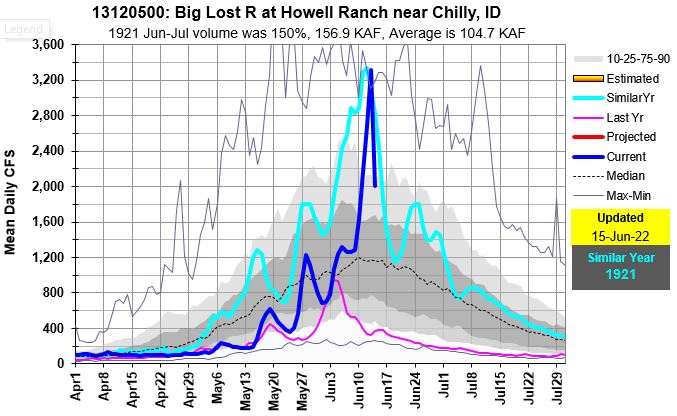
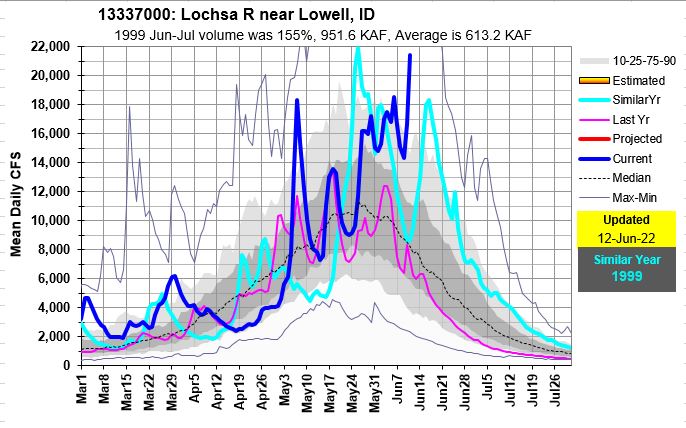
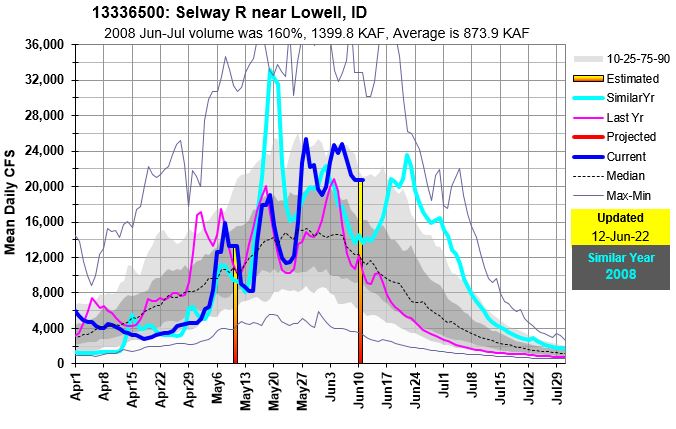
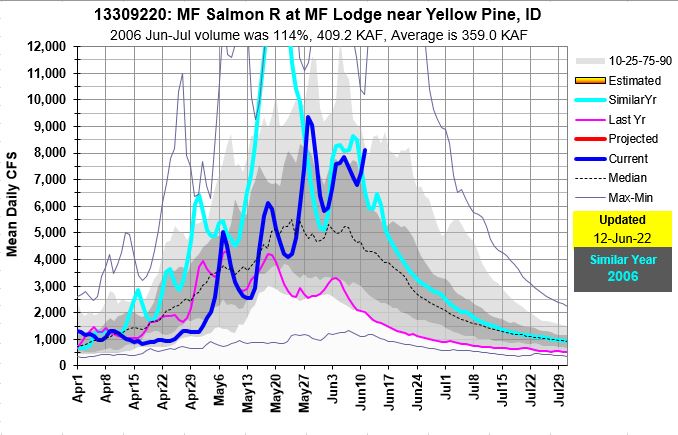
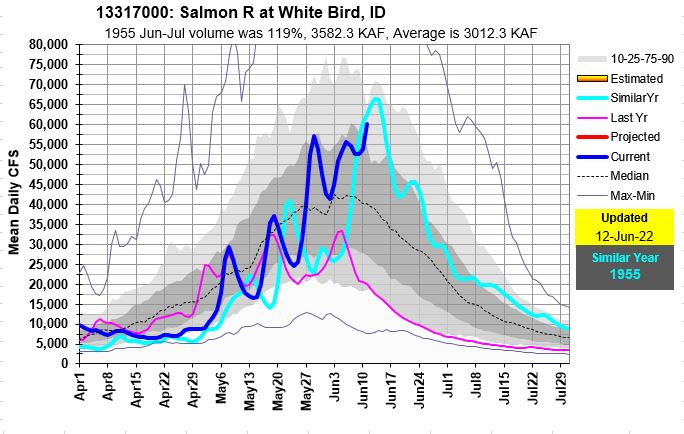
Peaks flows where amazing this year and occurred in all shapes and sizes depending upon snow, spring rain and air temps. Here’s a quick summary of them: the early one – Owyhee. Bookend peaks – Salmon Falls. Flashy pointed peaks – Big Lost & Big Wood. Rivers that remained high and kept pushing water out from their sources – MF, Salmon, Selway, Lochsa. And the late ones – Snake at Jackson and Teton, but when compared to historic average, they were timely.
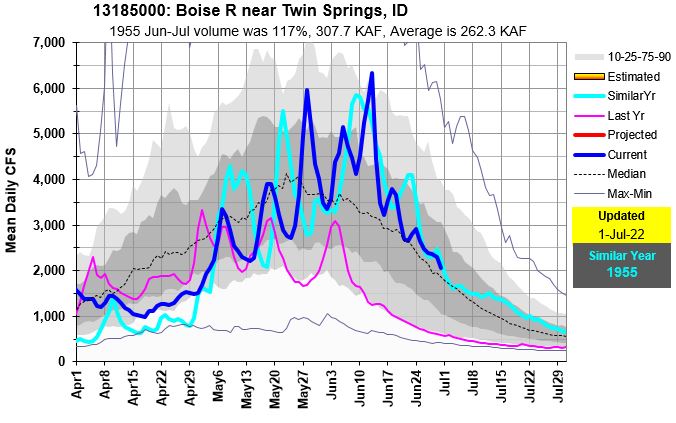
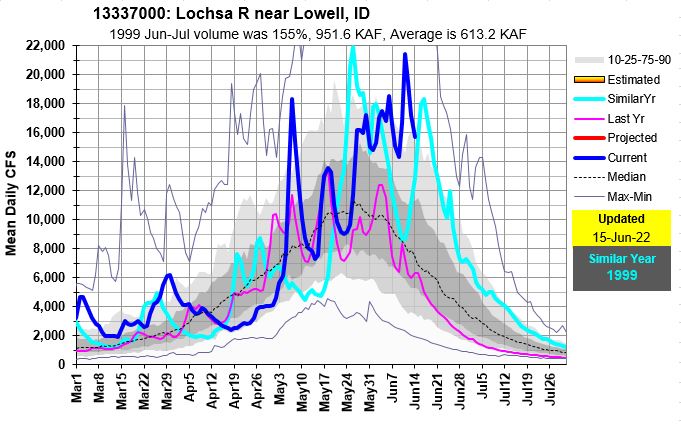
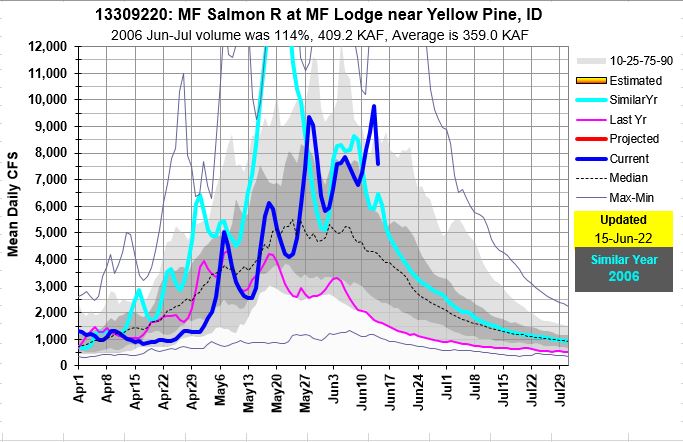
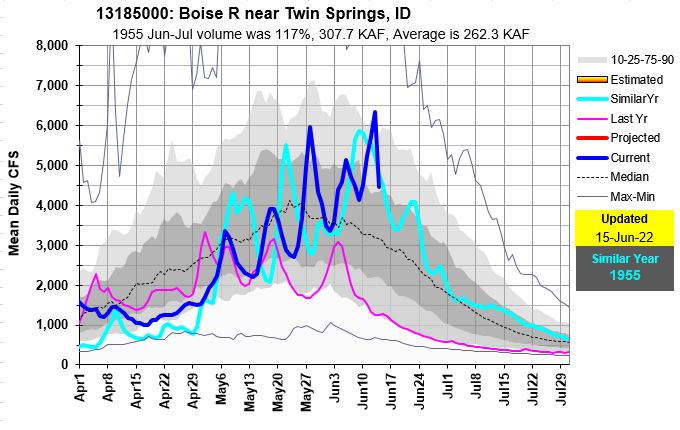
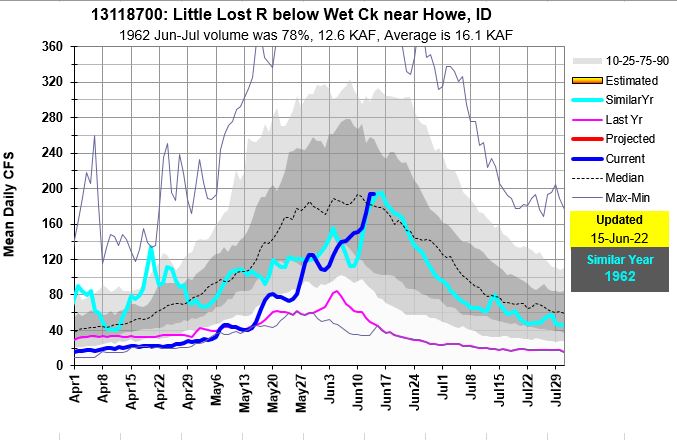
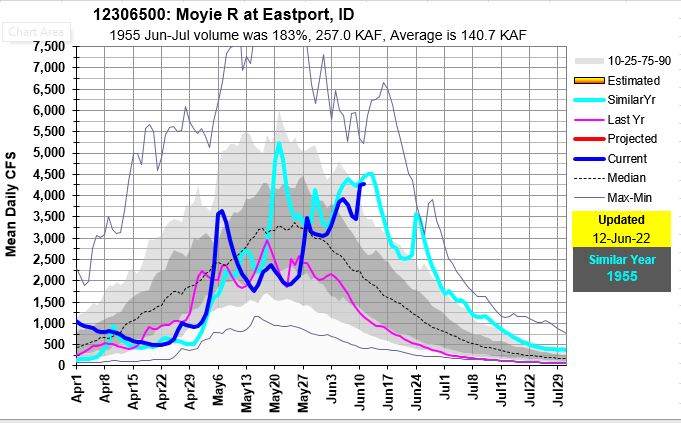
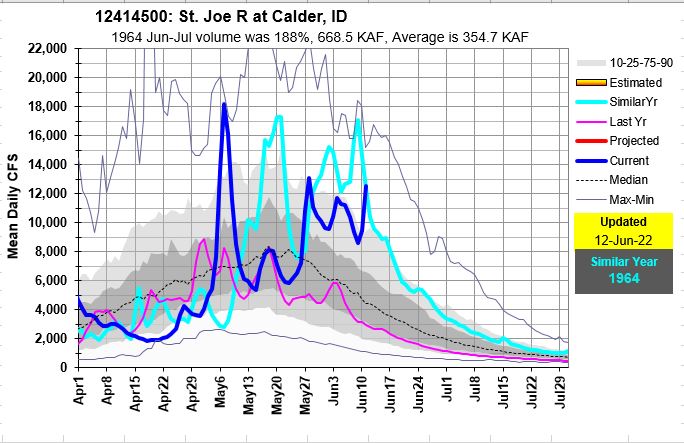
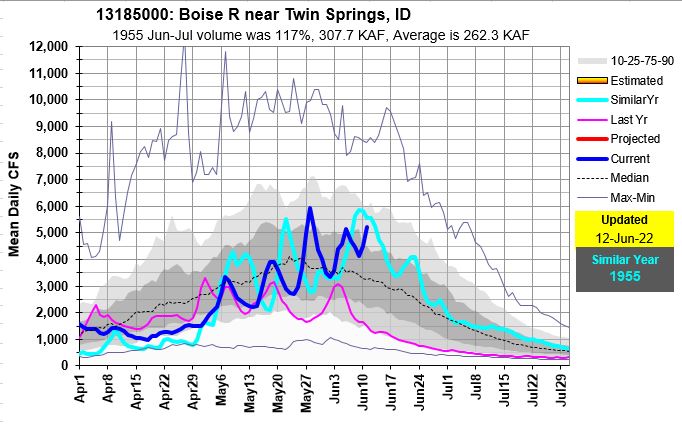
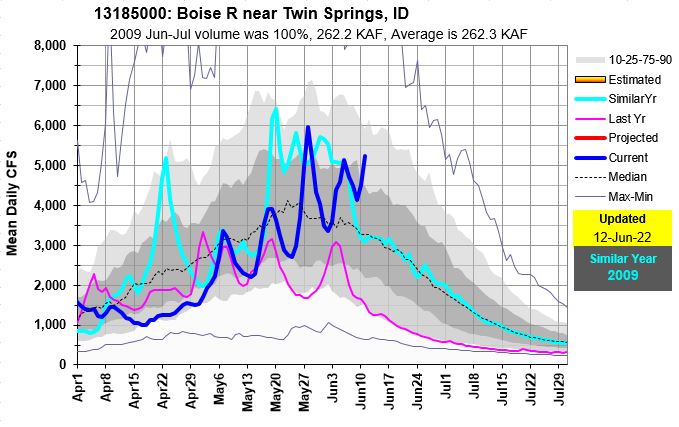
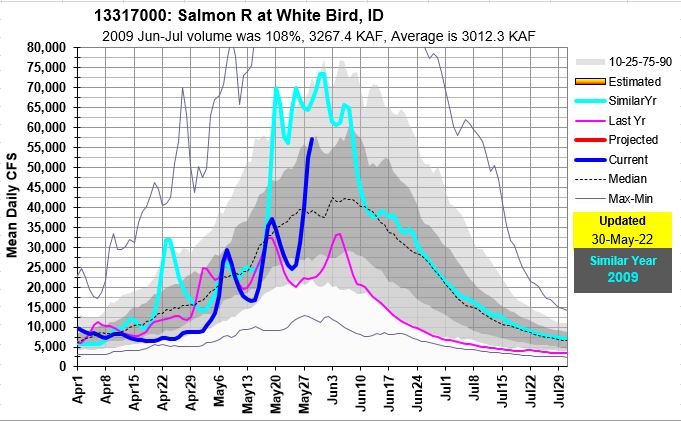
Following graphs show current year flow, last year and similar year to illustrate summer flow trends. Using the past years to predict the future still works when you are on the downhill side of the hydrograph.
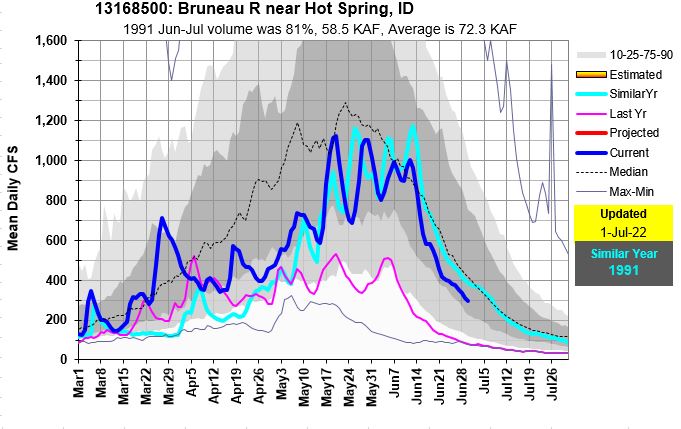
A March peak with good flows and blue skies! The Bruneau provided for those able to time it!DOA – Day of Allocation for natural flow/reservoir water users. Cool recession flow relationship illustrating that when the flow recedes to 2200 cfs is typically when DOA, happening now. Much better than the prediction from early April for June 20. Thanks Becca Garst for the analysis!
Here are the highlights or lowlights for some major decisions to be made…
It’s Now or Never for the Columbia and Snake River Basin’s Wild Steelhead
The last decade (2011–2020) has been the worst average on record for steelhead returns in the Columbia and still managed to average around 200,000 fish per year. (The last five years have been especially awful, and pulled the average down considerably.) The previous decade, 2001–2010, one of the best on record, averaged more than twice as many. Anglers who were fishing those years will tell you how good it was. In 2001, an astounding 633,000 steelhead passed Bonneville. Of those, nearly 150,000 were unclipped fish. We are a far, far cry from those kinds of numbers right now.
The largest single batch of water-use cuts ever carried out on the Colorado River is needed in 2023 to keep Lakes Mead and Powell from falling to critically low levels, the U.S. Bureau of Reclamation commissioner told a congressional hearing Tuesday.
Between 2 million and 4 million acre-feet of water use must be cut for 2023 across the river basin to cope with continued declines in reservoir levels…
“Eighty percent of Colorado River water is used for agriculture and 80% of that is used for forage crops like alfalfa. I’m not saying farmers should stop farming, but that they carefully consider crop selections and make investments to improve efficiency. By reducing their use of Colorado River water, agricultural entities will be protecting their own interest,” Entsminger said.
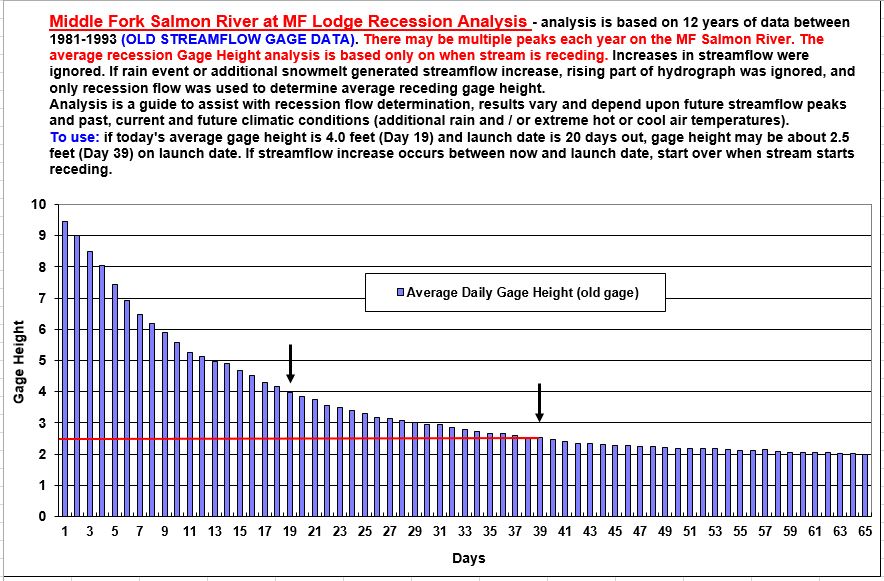
Did you get lucky and get a permit for the MF or Selway Rivers? Here’s a tool developed a while ago by Peter Palmer, Ron and crew, and it still works. Because Mother Nature melts the mountain snowpack that feeds the streams consistently (elevation, south and north facing slopes, and even burnt areas) from one year to another, the end result is snowmelt recession flows are consistent from year to year. Try using the graph to see what the flow might be on your future launch date to better understand potential river flow levels while also considering your risk level and boating skills.
It is designed to be used after the peak flow has occurred AND the river is in full recession. This is OBSERVED by watching the decreasing flow levels on the recession side of the hydrograph. If there is a future river peak from rain or additional snowmelt, just start over when the river starts receding again. The data used to develop the nice sloping curve is based only on when river flows were receding.
Give it a try and let us know how it worked to help predict your flow level on your launch date. These could also be helpful on other rivers to help monitor water right Day of Allocations, water right cut dates, critical low flow and more because of these consistent snowmelt / recession flow relationships that occur every year based on how the snow melts.
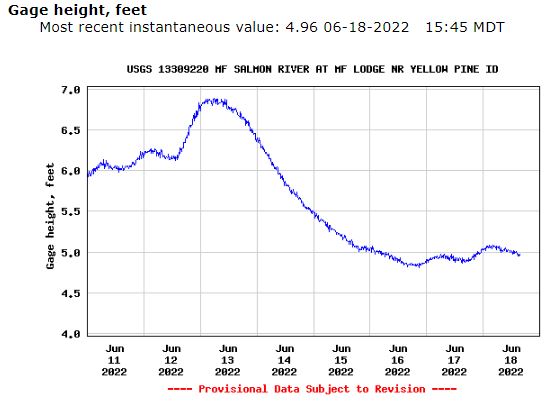
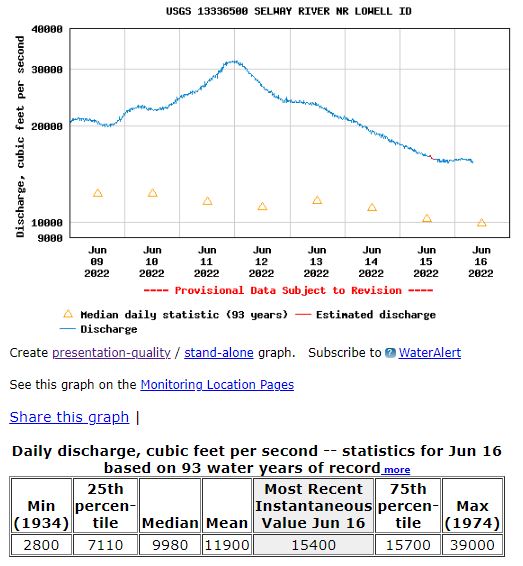
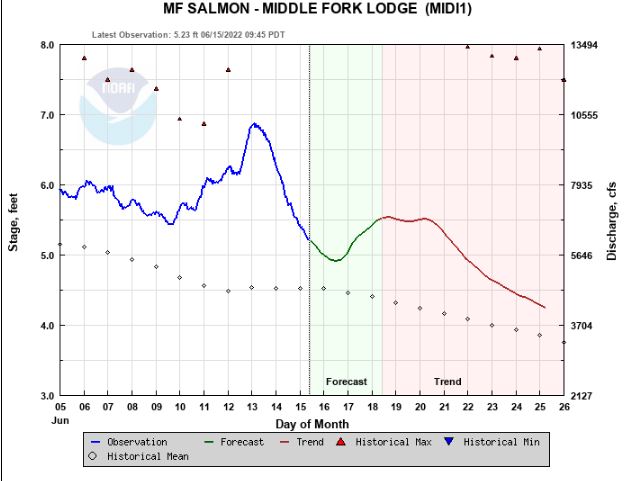
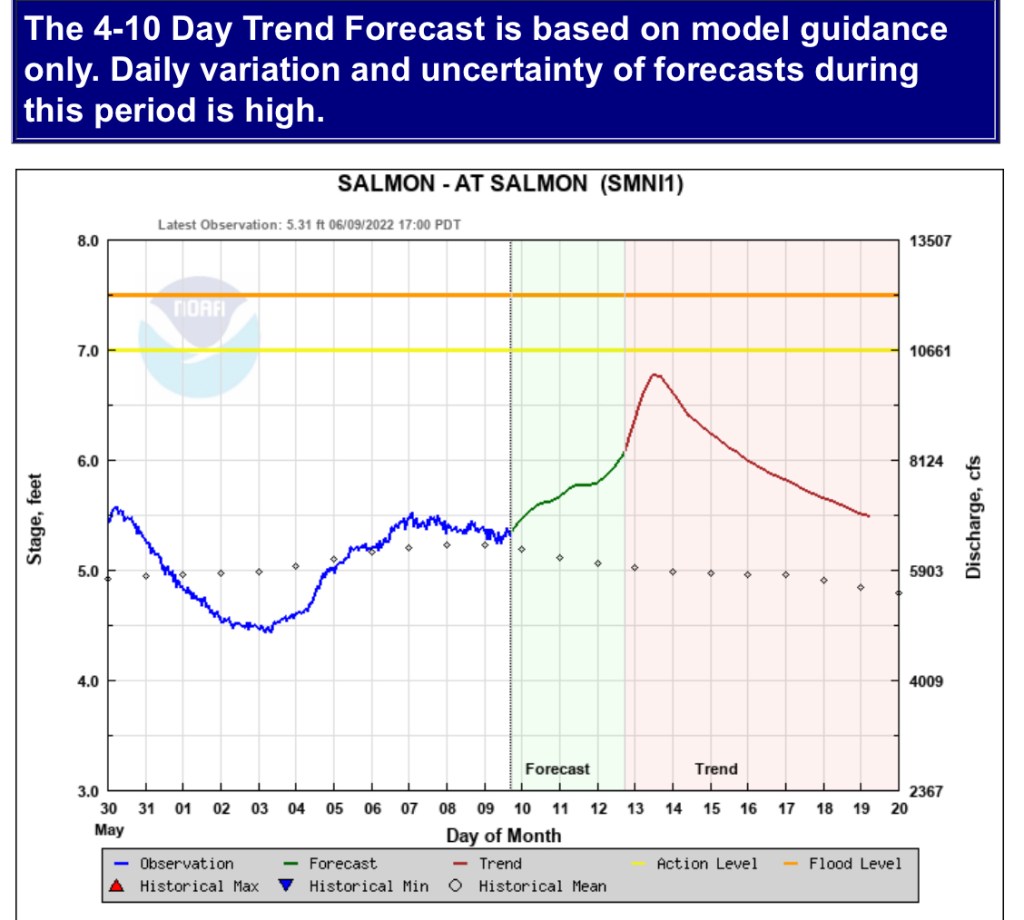
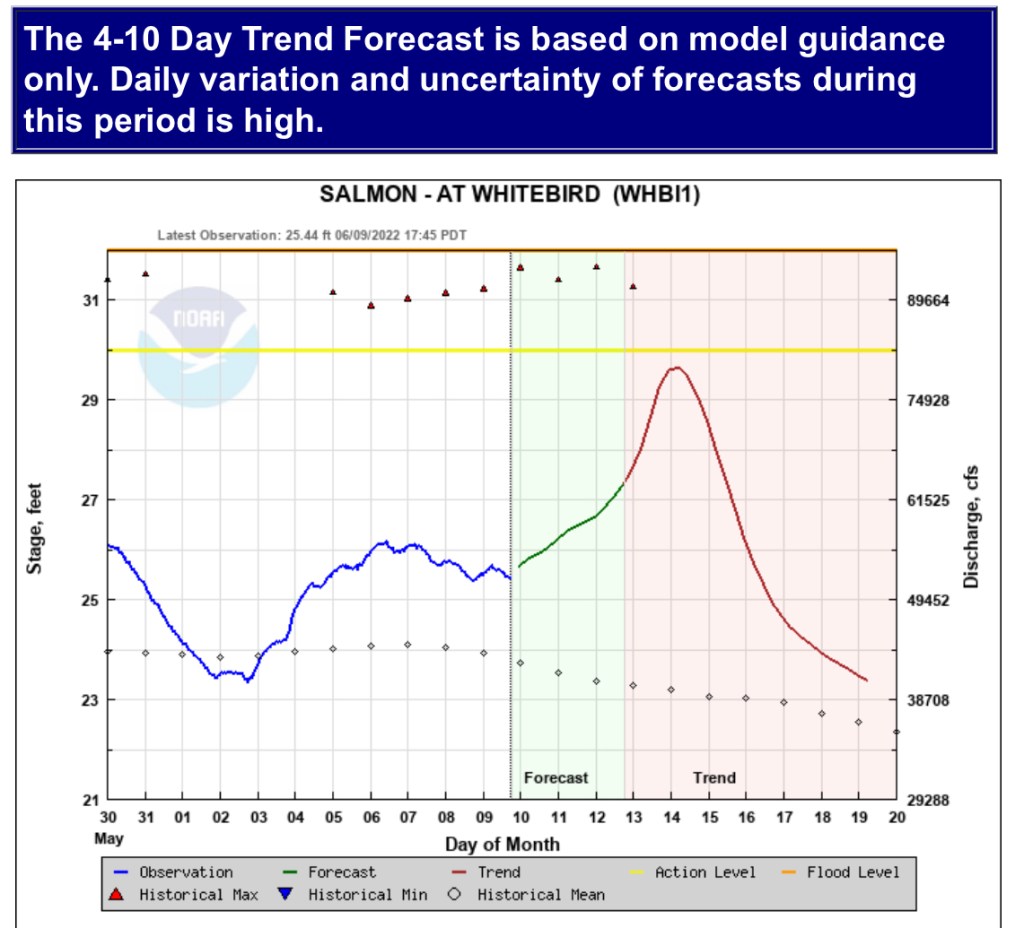
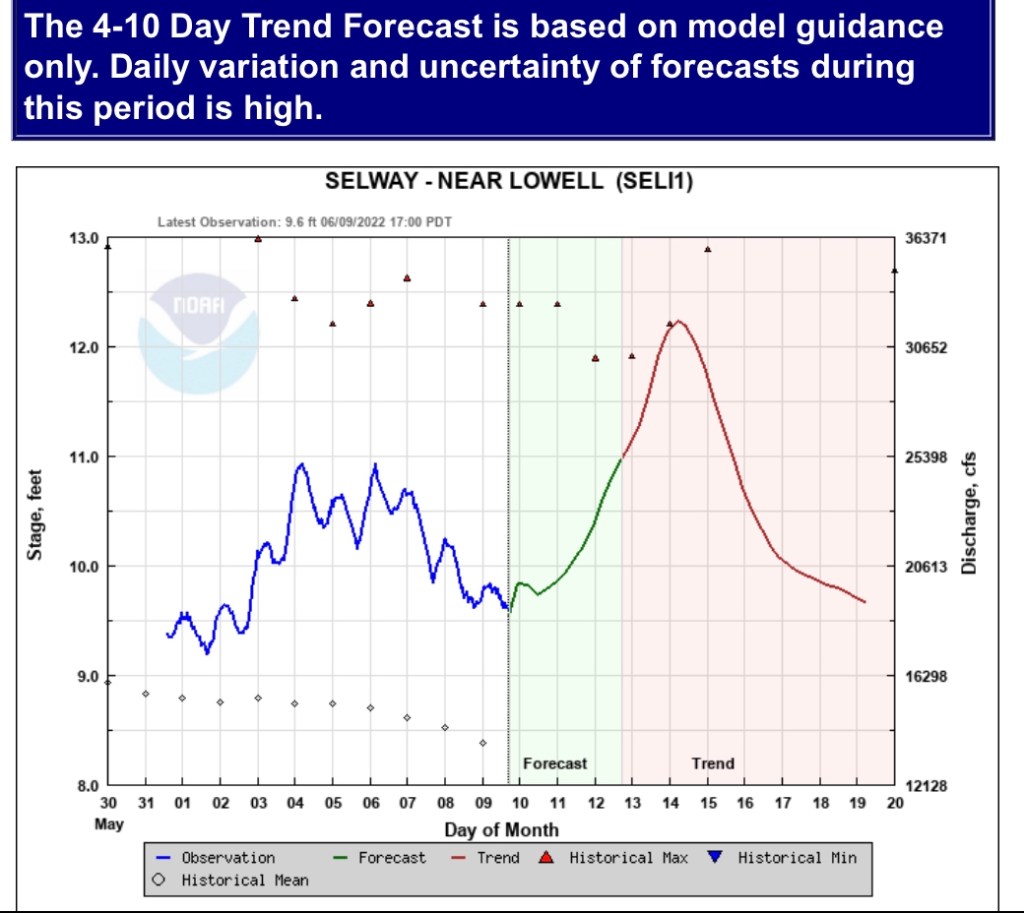
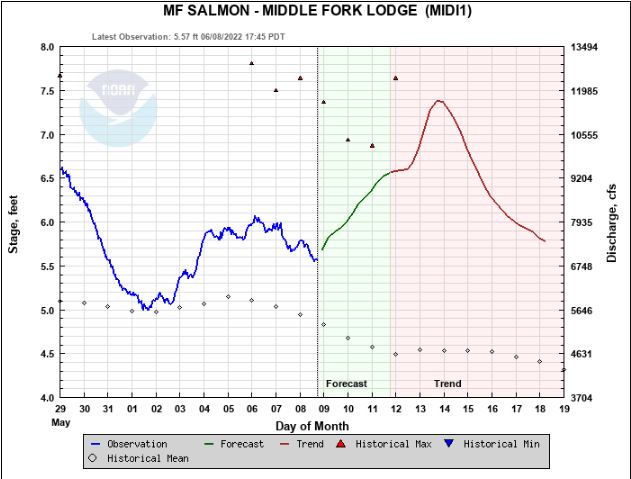
These two hydrographs show the MF Salmon and Selway Rivers ARE NOT in full recession because the current flow is holding steady or increasing from the warmer temperatures and /or remaining snow. The previous fast decrease in flow was a result of cooler air temperatures slowing melt and not because of the higher elevation snow that feeds the streams gradually being depleted. It is always cool to watch the diurnal snowmelt fluctuations each day as temperatures warm during the day and cool at night and impacts of as major cold fronts move through. This could be another post about what the timing of these daily diurnal snowmelt peaks really mean.
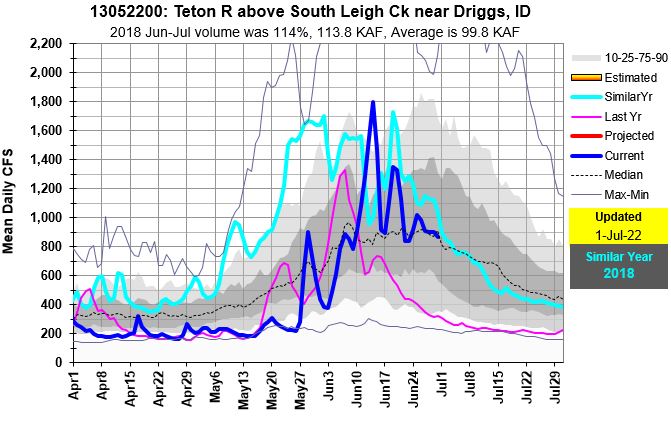
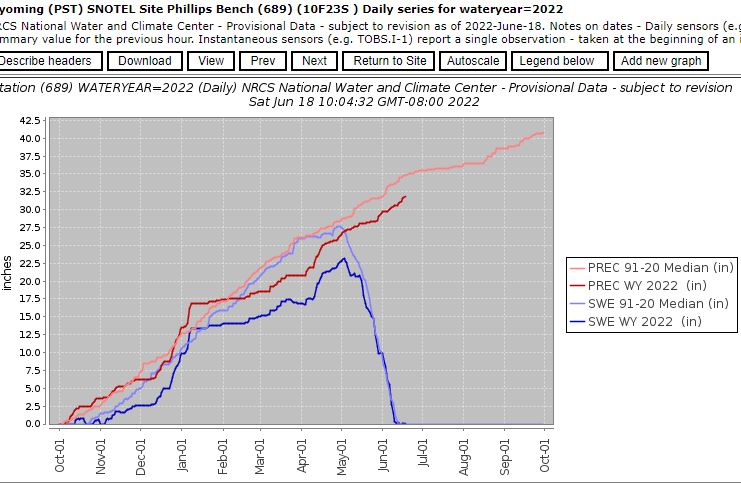
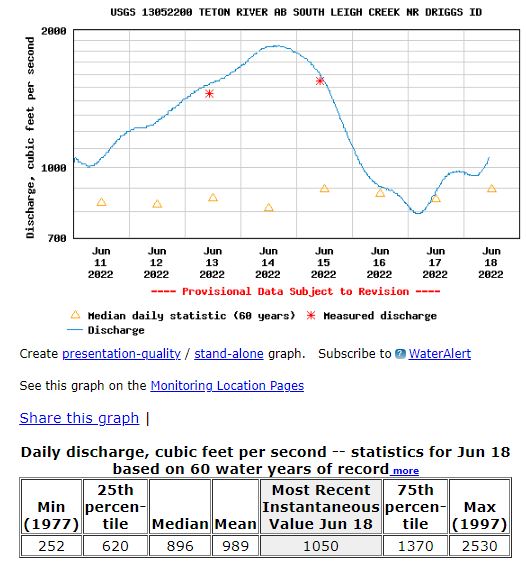
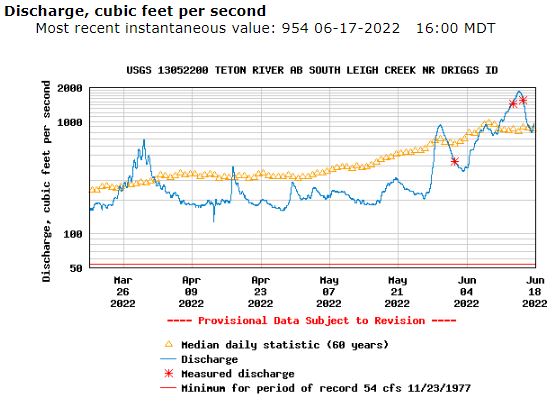
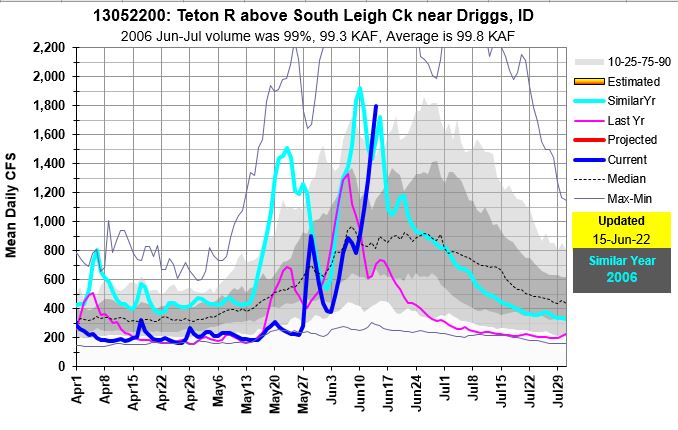
This Teton River runoff is a great example to explain of how these Snow to Flow Relationships are used to predict the ‘snowmelt peak’ as opposed to the ‘absolute peak’, a rain influenced peak which may be higher. Teton R still has enough remaining snow for another bump in flows from the remaining snowpack based on snow to flow relationship with Phillips Bench and Grand Targhee SNOTEL sites.
We’re now 7 days after Phillips melt out and right at Targhee’s half melt with 15.7” on the snow pillow. Flow is rising as seen with the diurnal snowmelt. Cooler temps will arrive Sunday to slow melt. Remaining snow will help sustain flows as they decrease again.
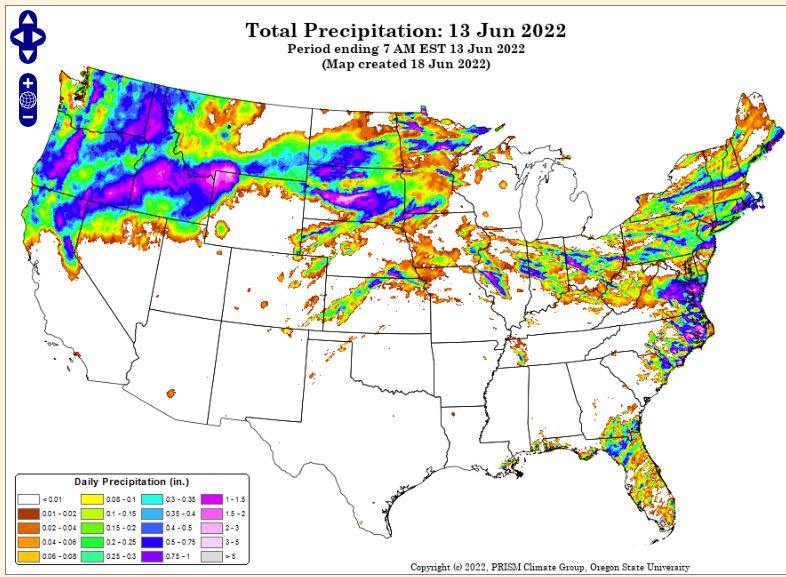
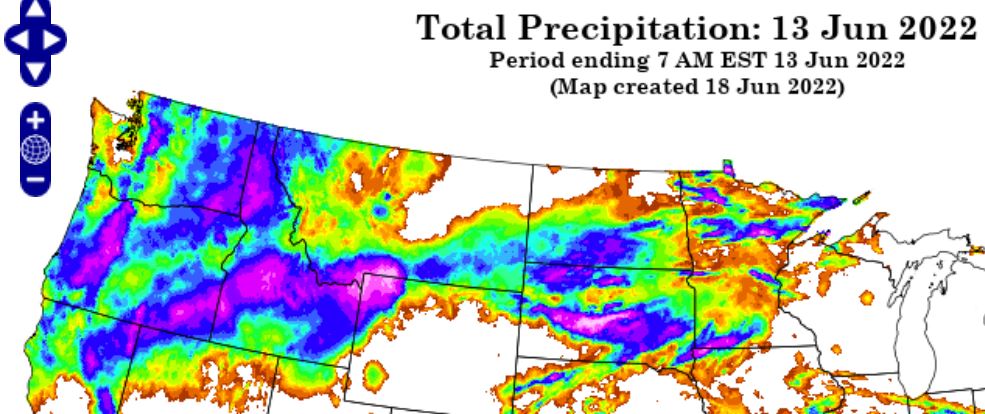
SWE at Grand Targhee peaked at 37 or 32” which puts half melt at 18-16” SWE, today’s SWE.SWE at Phillips peaked at 22.8” and melted out June 11. Peak occurs an average of 5 days after meltout.Note peak on Jun 14 was the absolute peak, highest for the season, and snowmelt peak will occur in few days which agrees with the Snow to Flow Relationships. Hydrograph below shows the full runoff season. Precipitation totals in inches for June 12 (5 AM MT to 5AM MT) to June 13 from PRISM, and zoomed in below.https://prism.oregonstate.edu/
A major cold front decreased temperatures allowing precipitation to fall as snow above 6,000 to 7,000 feet rather than as rain to bring an end to this unusual June Atmospheric River event. Unfortunately, our neighbors and friends to our east in the Greater Yellowstone area and Red Lodge area received higher rainfall amounts that combined with snowmelt to produce historic runoff amounts primarily on the eastside of the continental divide. Our thoughts are with you as continue to dig out and rebuild.
Temperatures, in Idaho’s west-central mountains at SNOTEL sites like Jackson Peak at 7,070 feet, reached highs of 60-65F for several days prior to June 11 and above freezing nighttime temperatures allowed the snowpack to melt 24/7. On June 11, the temperature reached 63F at 2pm and gradually decreased to 32F by 3AM Monday morning June 13. Sunday Jackson Peak received 1.5 inches of total precipitation as temperatures played a critical role allowing the precipitation to change from rain to snow in the higher elevations. These near freezing temperatures also slowed the snow melt that was feeding the streams prior to the storm. Temperatures remained in the 30s until noon Tuesday, June 14.
Monday morning, we headed north, packed the Subaru and dog (got 35.5 mpg traveling 870 miles in two days). You could see the new snow from Tamarack Resort to the Seven Devils range and in the Selway-Bitterroot mountains on Tuesday. What a beautiful site with green valleys below.
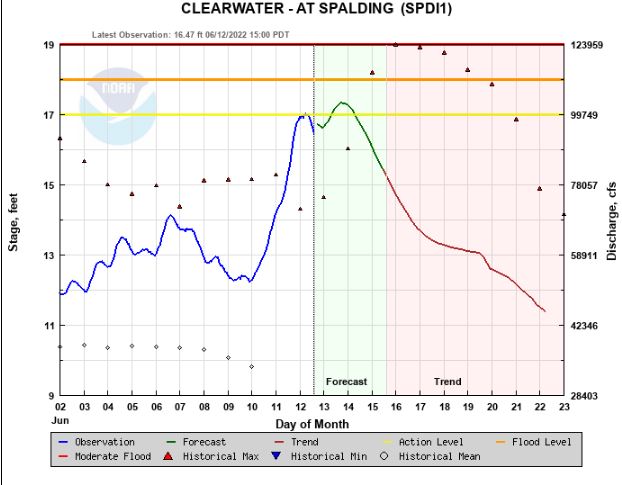
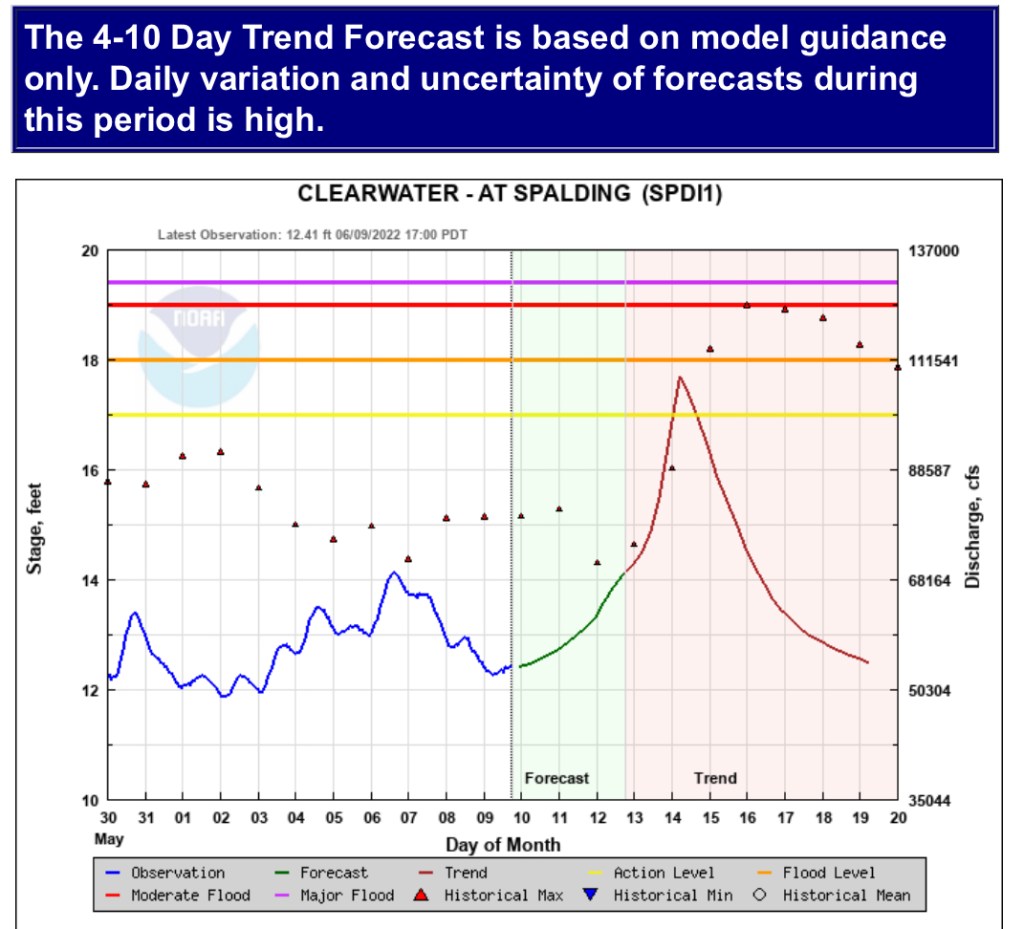
These freezing night temperatures slowed the melt as rain subsided forcing streams to peak lower and recede earlier than streamflow models were trending. Rain turned to snow to melt later which will help extend recession flows. This is good news as many were running bankfull and approaching record flows for this time of the year in the Clearwater basin.
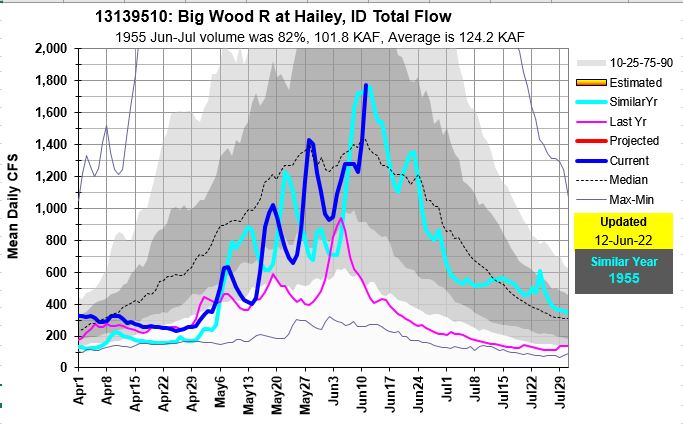
Following are current flow graphs showing this year, last year and similar year based on current flow. I included the Wood and Lost rivers, our next road trip that starts today. Who’s in or wants to talk rivers in the Ketchum area this weekend?
And post by Cliff Mass about why thunderstorms develop over mountainous areas. Cliff is from Seattle and his long range PNW temperature forecasts were right on for this area too. Not sure who to reach out to about Idaho tornadoes because we don’t have many. https://cliffmass.blogspot.com/2022/06/why-do-thunderstorm-prefer-mountains.html
Be safe as rivers are still running high and flowing fast with swift currents and strong eddies that are fun to watch from a distance. Rivers are bankfull with steep drops into the cold water. Know your river running limits if you are putting on the river. If you are a fair weather floatier, I’ve seen two forecasts that says warm, dry, hot weather will arrive for the last 10 days of June. Be safe and enjoy another cool, wet weekend!
Major increase followed by decrease from cooler temperatures. 1974 was a huge snow year with record high flows.Some missing data…
Saturday mountain temps were around 50F in northern Idaho allowing about a dozen SNOTEL sites to melt 1.5 to 3.0 inches of snow water in a day in addition to the 1 to 1.5 inches of rain that fell. End result – rivers are very high, some at record high. Clearwater R at Spalding is pushing 100,000 cfs, record high for today based on 50 years of data. More rivers will continue rising after Sunday’s rain and snowmelt.
Flood control releases start Monday at 8AM for Boise R with flows at Glenwood Bridge going from 1250 to 2750 cfs by 10AM.
Here are few graphs to illustrate how high these flows are compared to historic exceedances, and max levels that show this year, last year and similar current flow year.
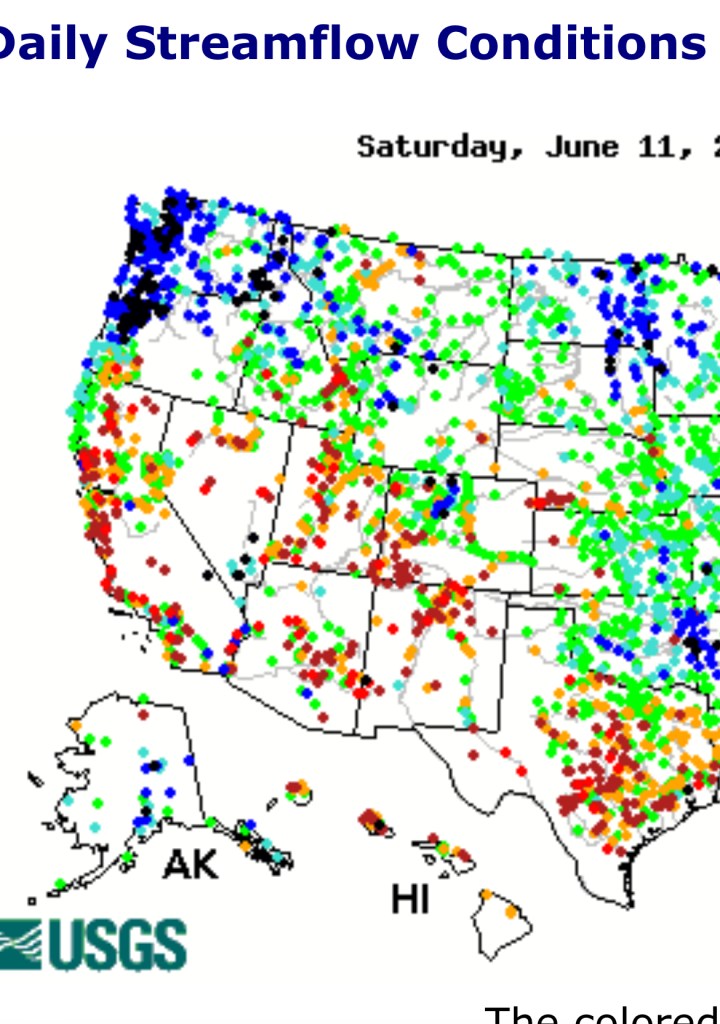
These current USGS flow conditions map for today and yesterday are always cool to watch as the wet basins move across the nation. Black pins represent record high flows. I’m sure we’ll see more in Idaho tomorrow. https://waterdata.usgs.gov/usa/nwis/rtLink to NWS Forecast Center for streamflow forecasts/trends. https://www.nwrfc.noaa.gov/rfc/hydrographs/
An AR is moving in and that doesn’t stand for Abramovich.Ron but is a major June Atmospheric River precipitation event. 1-2” of precipitation is predicted with snow on the highest peaks in the west-central mountains. Rivers will rise next week!
Time for a road trip next week to check out the flows, who’s in?
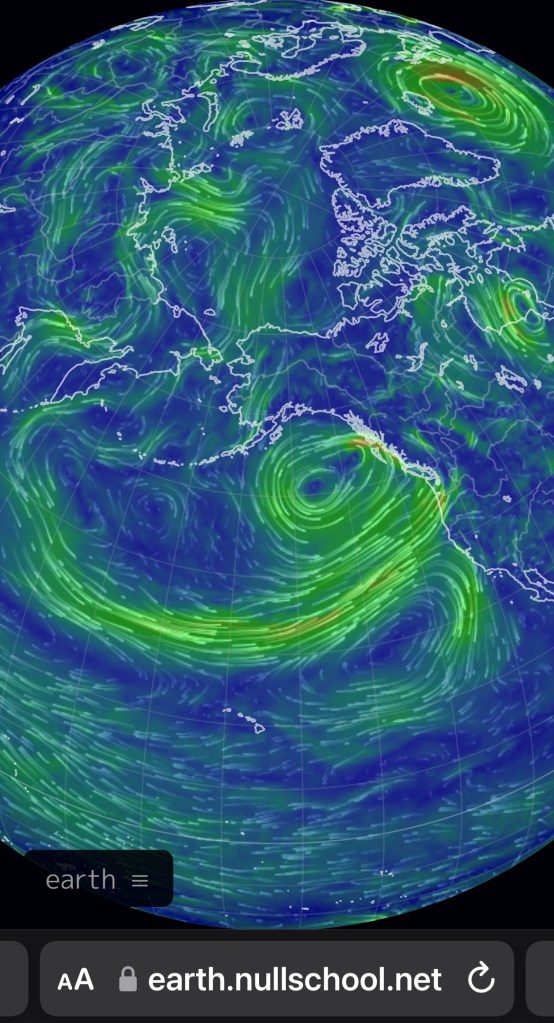
June 9 surface winds
Many SNOTEL sites in central Idaho just melted out. The ones that still have snow are losing 1-2” of SWE a day! This means there is 1-2” of water melting out of these high snow fields. This and recent rains were enough to keep river flows up and allow them to drop yet. This weekend, 1-2” of moisture is predicted across many of these ripe basins.
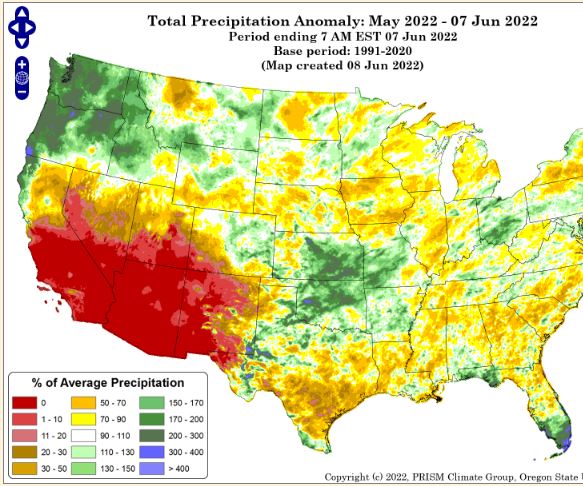
This is where it gets interesting – the Boise basin has already received 75% of its normal June precipitation in the first 9 days of June – enjoy the green foothills and morel hunting.
There is no need to talk about the Snow to Flow relationships at this point. These work best to determine when the snowmelt peak may occur verse the absolute peaks (the highest seasonal peak flow). Believe me, we’ve had many fun discussions about the difference of these peaks and how to best predict them. Next week’s peaks will be rain influenced and higher than the previous peak. The Snow to Flow Relationships are telling us how recent the snow peak occurred, how much snow remains to feed the streams, and which rivers have not peaked yet, like the Teton River.
Rain peak typically rise faster and receded fast than snowmelt peaks, the remaining higher elevation snow will sustain flows. This is best explained in Idaho Power’s operation summary and duration of high flows.
The Brownlee Reservoir 3-day average inflow is currently 24,000 cfs, and the Hells Canyon Dam 3-day average outflow is 21,000 cfs. The current weather forecast for the Payette River and surrounding basins show significant precipitation for this weekend. This expected precipitation has significantly increased the inflow forecast for Brownlee Reservoir which is near full pool. Idaho Power will be increasing discharge below Hells Canyon Dam this afternoon and those increases could persist for the next two weeks. Boaters below Hells Canyon Dam can expect flows to range from 15,000 cfs to 30,000 cfs. Boaters should remember that actual operations are subject to change due to system reliability, and they are encouraged to be aware of changing river conditions.
Natural flow for the Boise River today is 7,728 cfs into Lucky Peak while the Boise Reservoir System is 86% full; the Payette system is 93% full. https://www.usbr.gov/pn/hydromet/boipaytea.html
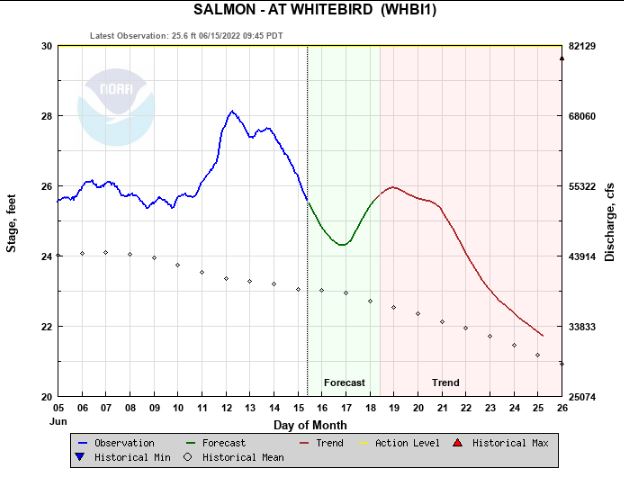
Here are NWS river flow projections. Stay safe, know your limits or enjoy our amazing rivers from a distance.
OPEN-ing blog – here’s a start that is still under construction… Hope it helps to share info learned about Snow Weather and Flow relationships, so we don’t forget what was learned.
The roller coaster – warm/dry – cool/wet – weekend weather pattern will continue this weekend and possibly another weekend. This cool/wet trend started in early April bringing much needed valley rain and mountain snow across the PNW and into Idaho. Adding moisture to the pack, delaying melt, increasing water supplies, decreasing irrigation demand, pushing streamflow peaks out and extending recession flows. What more could one want? Here’s a brief recap of the spring weather that illustrates the weather impacts on our rivers / water supplies.
I’ll post more basins soon and updates as we transition from season to season and where we are on the streamflow hydrograph because it’s all about water & weather – from what we wear, how & where we recreate, crops we grow and how they grow, hydropower produced, fish migration, and more…
Stay safe and know your skill limits as some rivers still have enough snow and weekend rain potential to keep feeding them and deliver another peak until the drier summer weather pattern that we all love arrives…
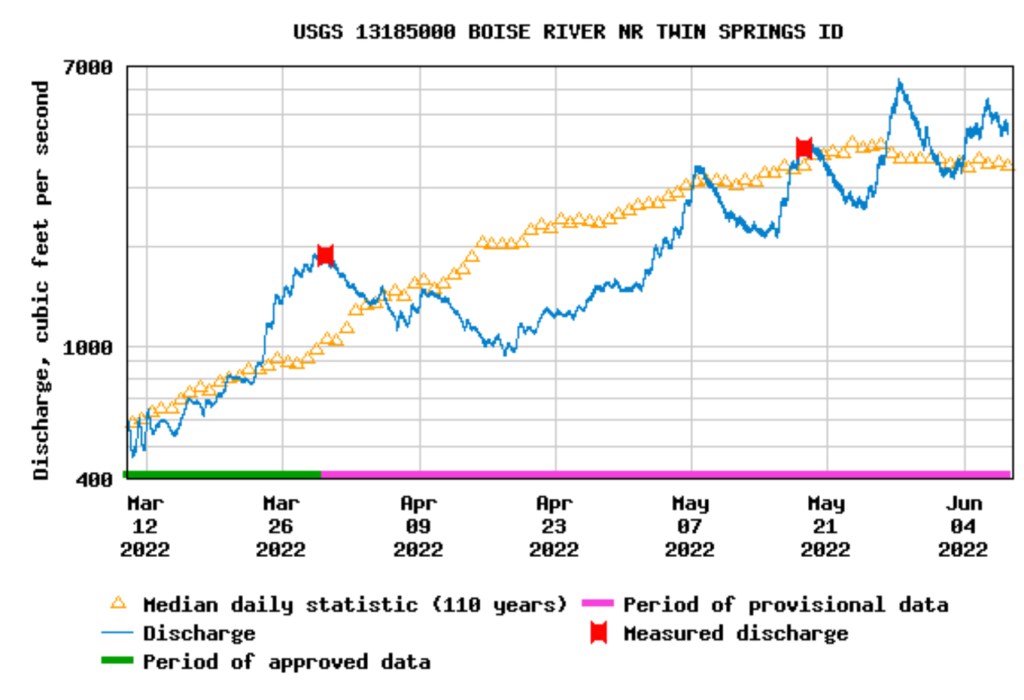
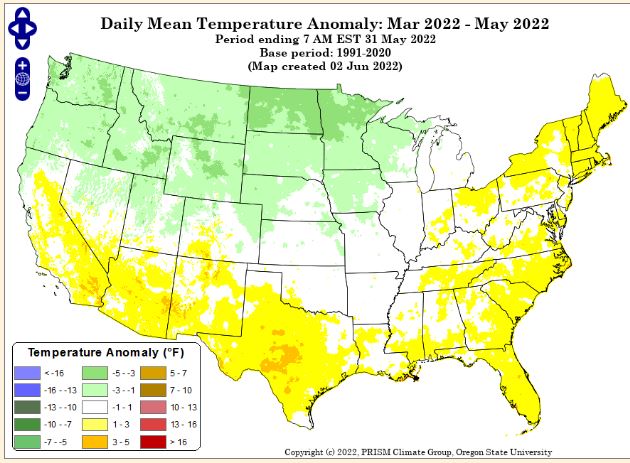
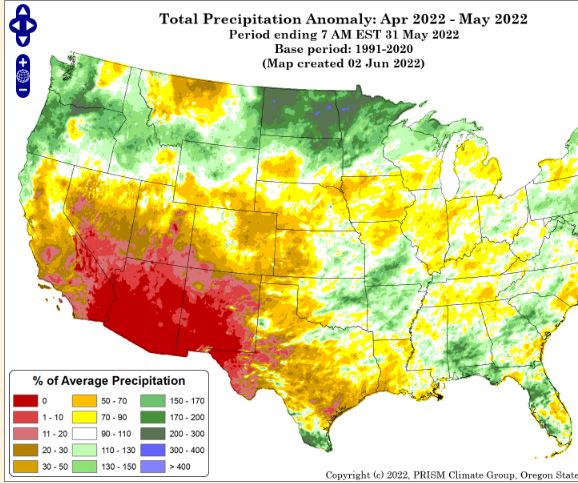
FYI – there’s a planned increase for the Boise River in town for Thursday June 9 – Reclamation is releasing fish flow augmentation water with +500 cfs at 8:00am. +300 cfs on Friday June 10, and another +500 cfs on Monday June 13. This will last approximately 2 weeks.Boise R near Twin Springs flow tracks the weather very well – March 28 peak from the ‘January Thaw’ that occurred in March, followed by below normal April temps & flow, and yoyo like temps with weekend storms resulting in peaks on May 7, 20, 28, Jun 6 & 13 (see last figure NWS MF projection).March to May precipitation moving into PNW but not southern Idaho / western Wyoming.Mar Apr May cool temps benefited the snowpack across the PNW and northern Midwest.April and May brought valley rains and mountain snow pulling out smiles on skiers, water users and river runners.May to June 7 precipitation shows trend continues in PNW while leaving SW high & dry.June 8 NWS MF Salmon River flow forecast & trend – wow !
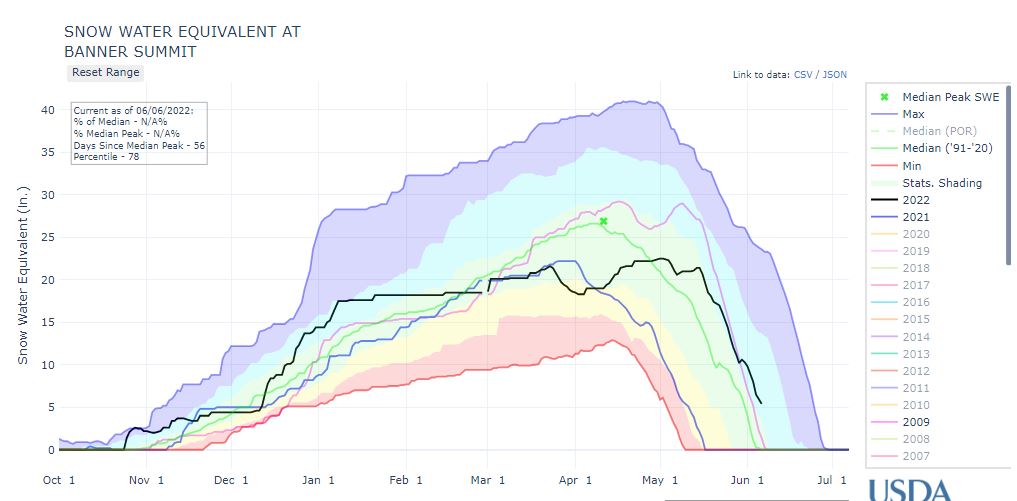
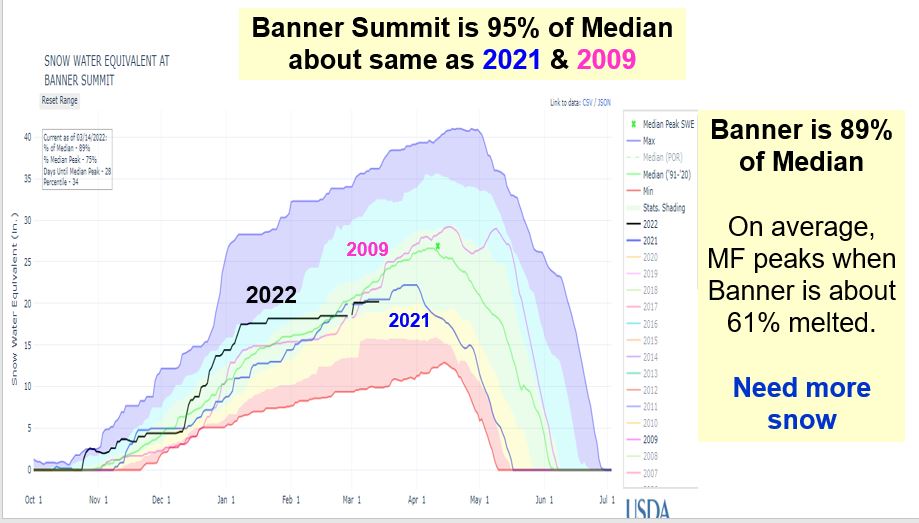
June 1 NRCS Jun-Jul forecast is for 430 KAF 134% of median.Mar 13 2022 Banner Summit SWEJune 1 2002 NRCS Jun-Jul volume forecast is for 3000 KAF 116% of median.