
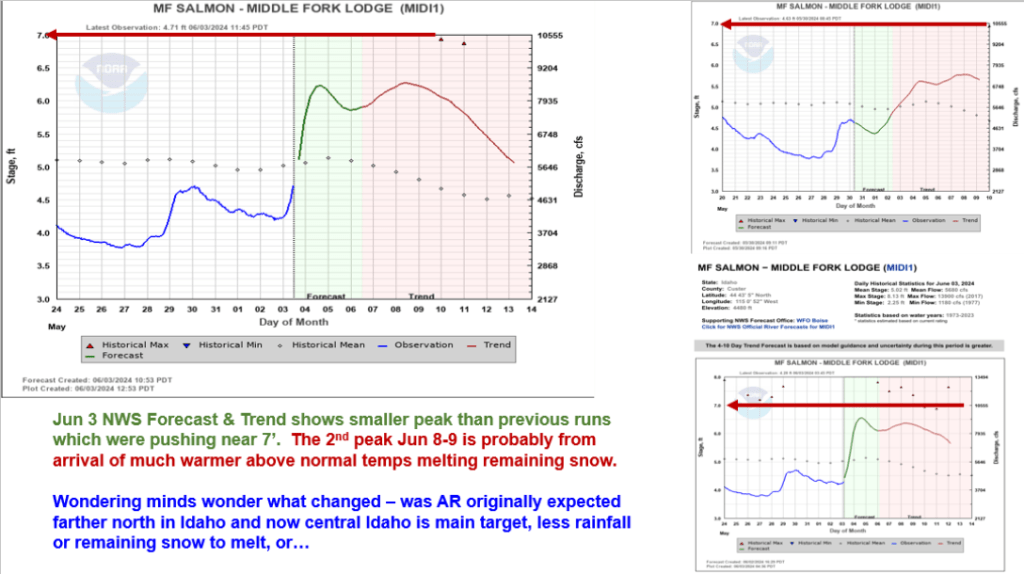
Here’s an update based on current info. We’ll see later today and tomorrow how high these rivers peak. Here’s a link to previous post to project flow levels on your launch date for MF & Selway. Give it a try and see if still works after the peak has occurred. No cheating, wait for the peak… and play it safe. https://snowweatherandflow.blog/2022/06/19/mf-salmon-and-selway-rivers-recession-flow-estimation-tool-for-use-after-peak-flows-have-occurred-and-river-is-in-full-recession/
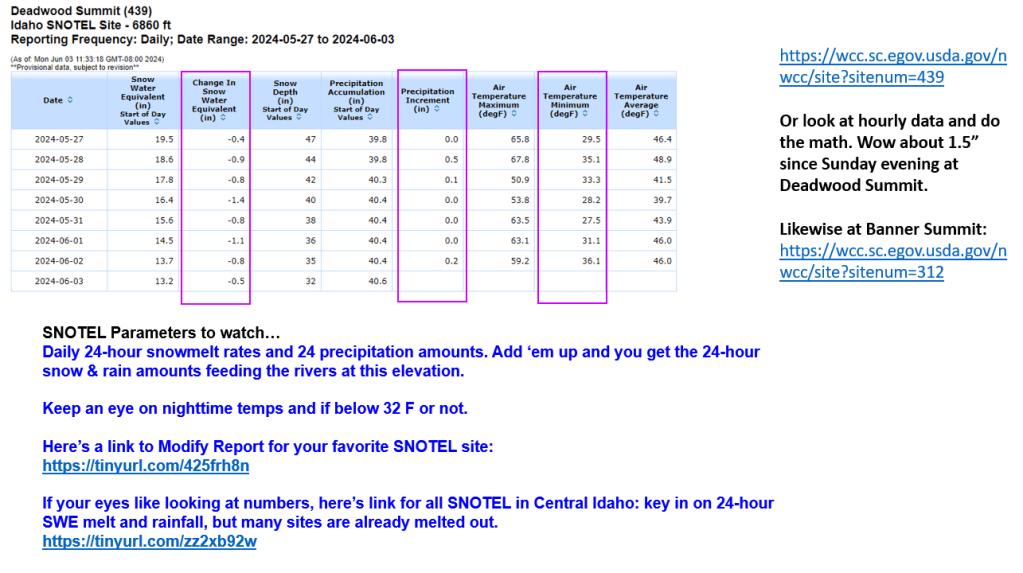
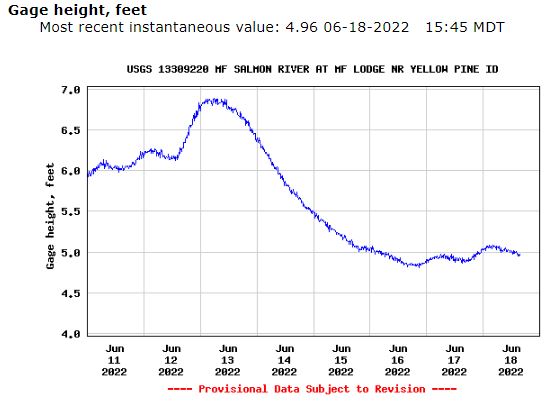
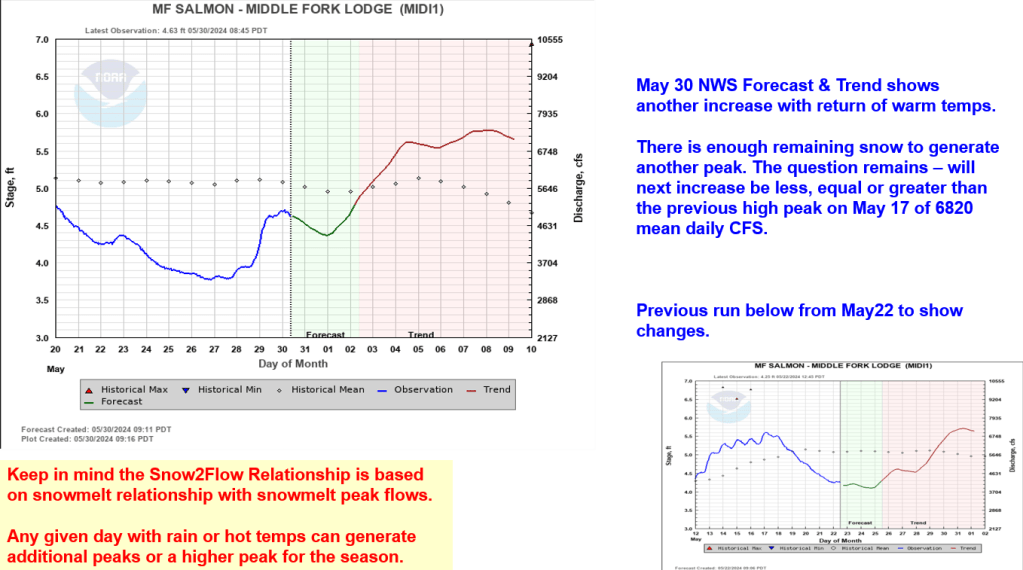
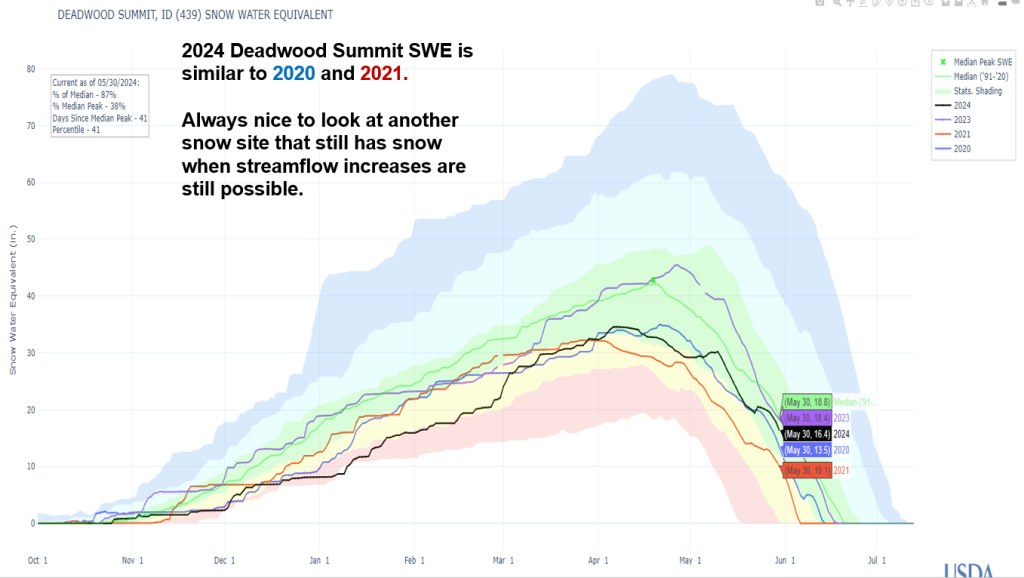
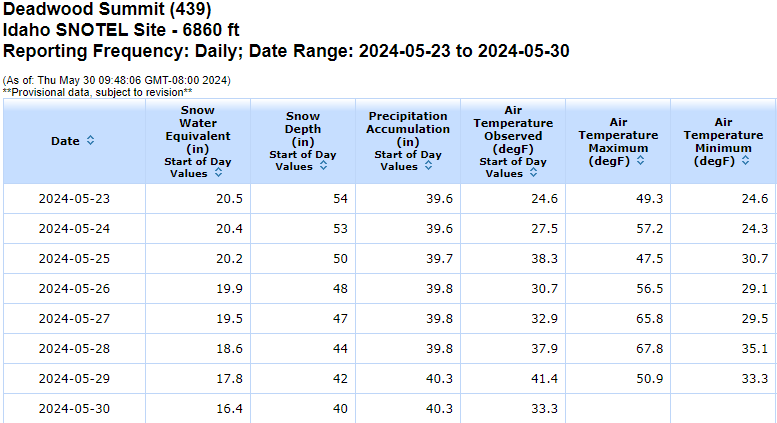
With the return of warm temps, rivers are rising again. The last cold front slowed the melt down to a few tenths per day and increased to 1.4″ yesterday with temps reaching 67 F at Deadwood Summit. With these yoyo like temps and some precipitation remaining in forecast, expect a few more ups n downs in flow levels before full recession starts.
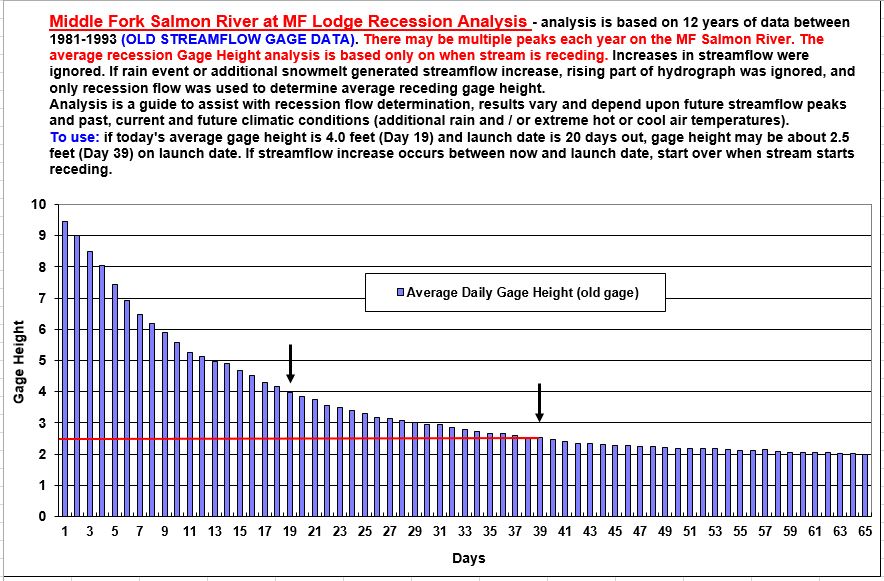
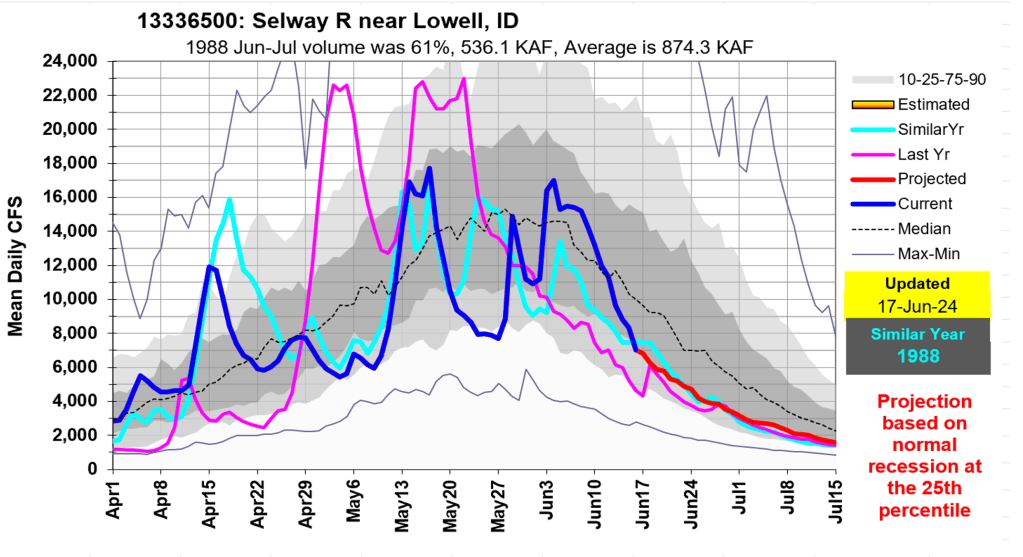
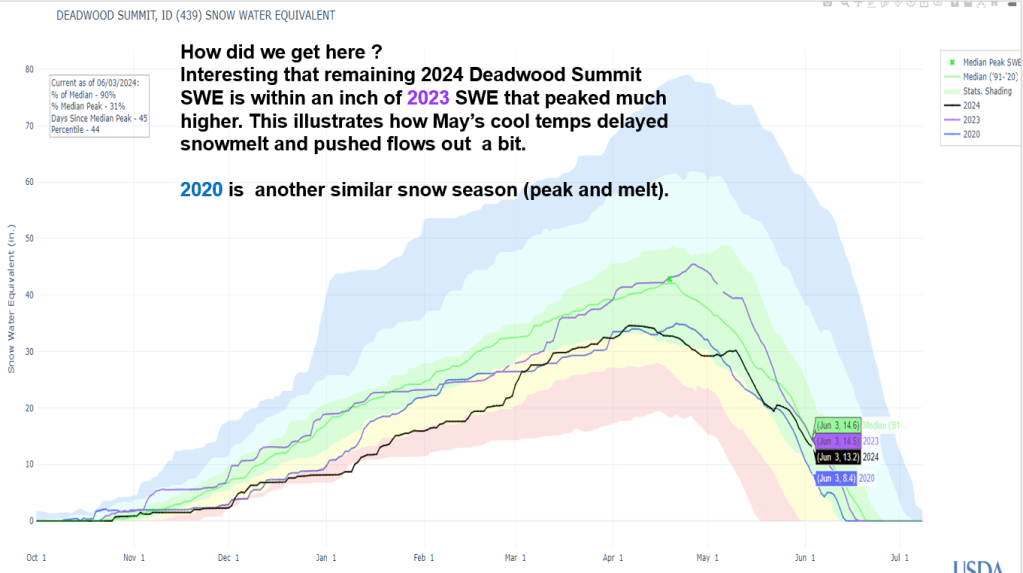
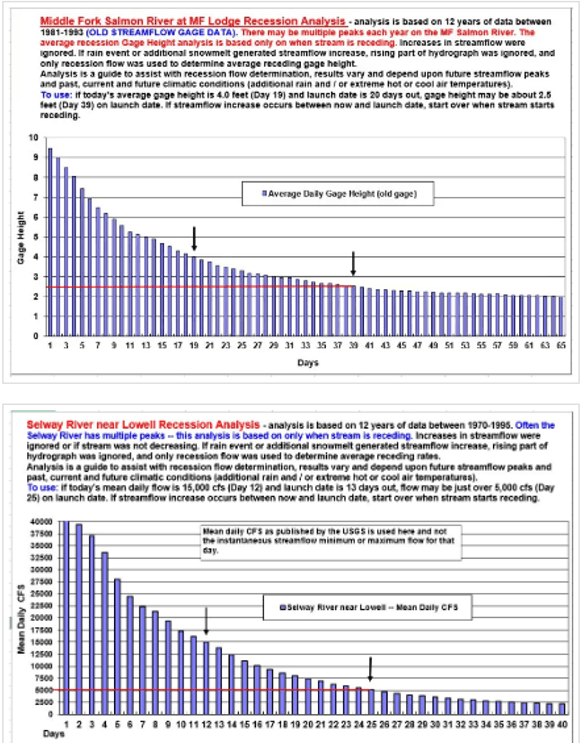
Did you get lucky and get a permit for the MF or Selway Rivers? Here’s a tool developed a while ago by Peter Palmer, Ron and crew, and it still works. Because Mother Nature melts the mountain snowpack that feeds the streams consistently (elevation, south and north facing slopes, and even burnt areas) from one year to another, the end result is snowmelt recession flows are consistent from year to year. Try using the graph to see what the flow might be on your future launch date to better understand potential river flow levels while also considering your risk level and boating skills.
It is designed to be used after the peak flow has occurred AND the river is in full recession. This is OBSERVED by watching the decreasing flow levels on the recession side of the hydrograph. If there is a future river peak from rain or additional snowmelt, just start over when the river starts receding again. The data used to develop the nice sloping curve is based only on when river flows were receding.
Give it a try and let us know how it worked to help predict your flow level on your launch date. These could also be helpful on other rivers to help monitor water right Day of Allocations, water right cut dates, critical low flow and more because of these consistent snowmelt / recession flow relationships that occur every year based on how the snow melts.