Here’s an update given Feb 16 at the Idaho Hay & Forage Conference. Includes a summary of last year and 2009 analog year followed by current snow, water supply, soil moisture and weather outlooks for these basins across southern Idaho – Owyhee, Weiser, Payette, Boise, Big Wood, Big Lost, Snake, Salmon Falls Creek & Goose Creek.
Here’s a long PDF talk explaining 2022 snowfall and runoff compared to analog year 2009. This provides the background to better understand Pete Parson’s 2023 analog years. These current analog years are 2000, 2009 (again), & 2012 and runner up years of 1957 & 1972. January 15, marks the half way point of winter. A return to stormier and cooler PNW is predicted next week, which is great and unlike last year! Time will tell if we track one of these analog years or not. And if a late snowmelt as observed in the analog years occurs as winter ends and flows into spring. Spring melts away as rivers increase. Stay tuned and enjoy the ride…
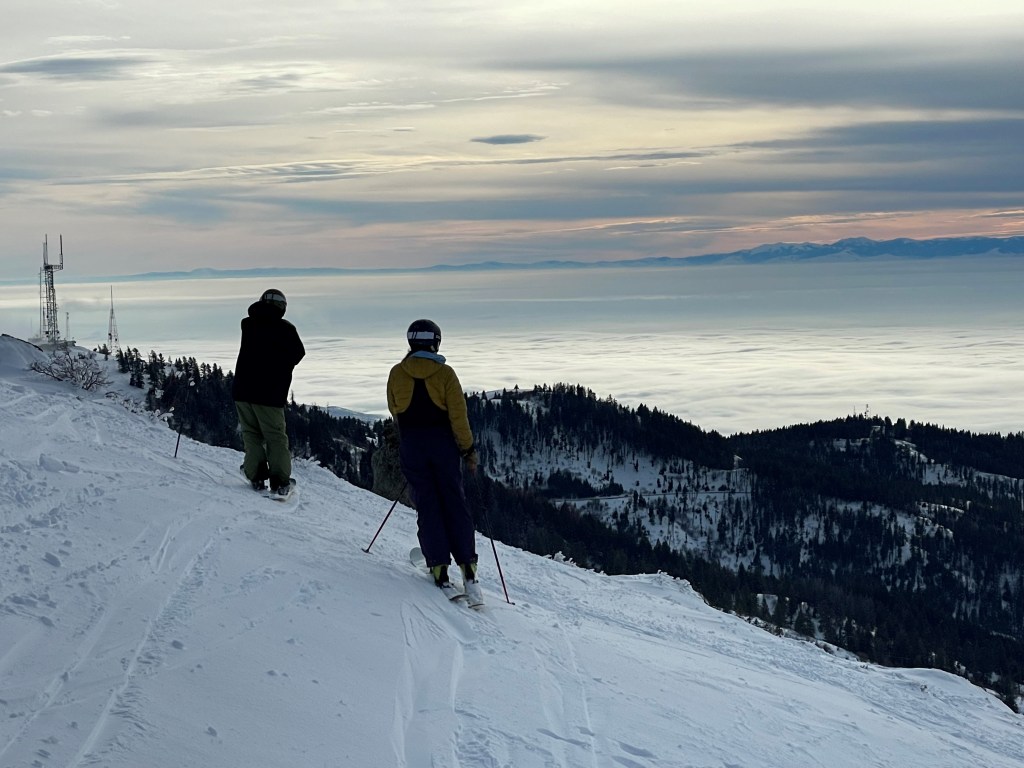
Keep your eye on the horizon and let’s hope the storms continue building snowpacks across Idaho in the 2nd half of winter!!!
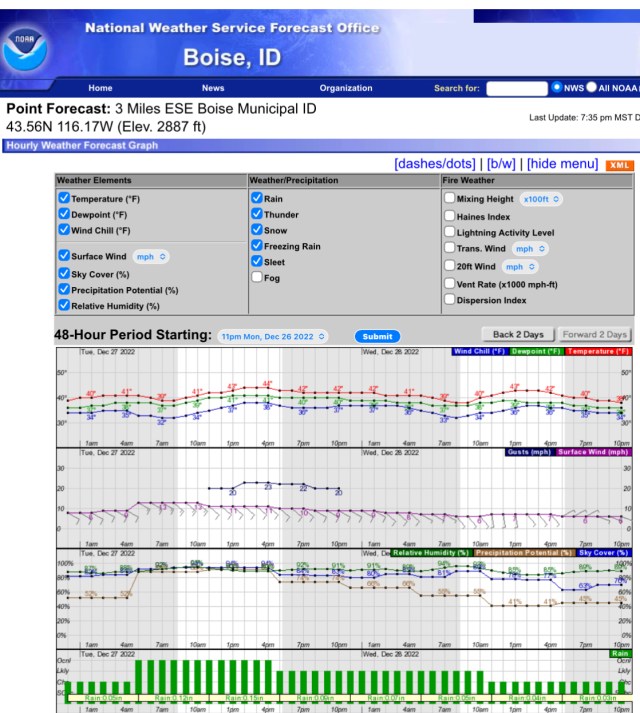
Now this is gonna get interesting… who remembers what the meaning of life is – from hitchhikers guide to the galaxy ? 42 and this is also Boise’s Magic temp for snow to be falling at Bogus, for most storms. Let’s Keep It Simple Silly (KISS) so we don’t have to explain the adiabatic temp lapse rate decreasing 3F /1000 ft increase in elevation.
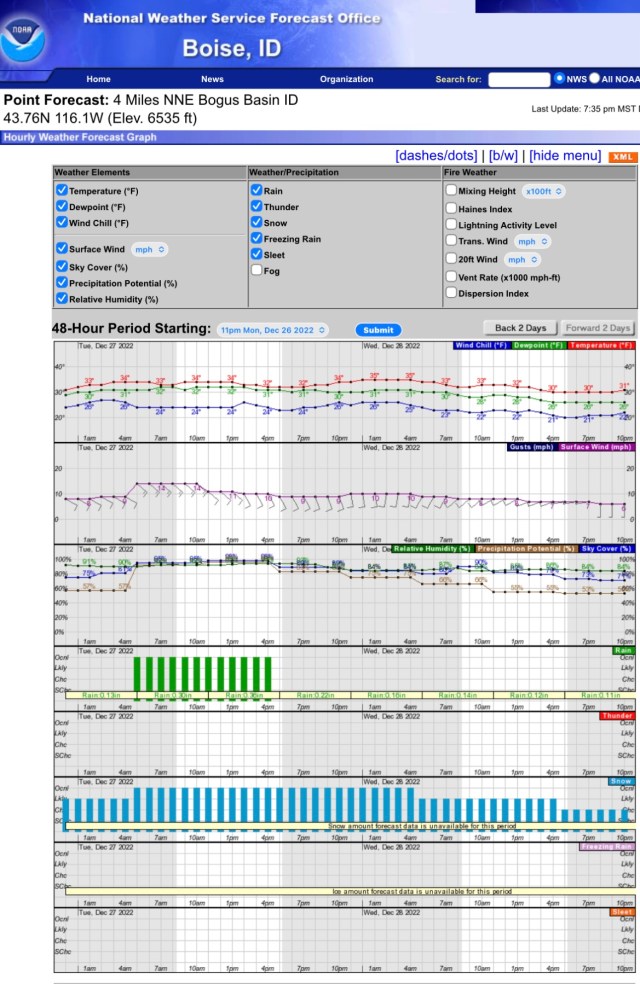
The NWS forecasts for Boise for Tues shows temps pushing 43 F and Bogus at 34 with rain snow mix and snow line / level around 6,600 ft !!! Elevation matters and makes a difference! Stay tuned and let’s hope the snow on ground and frozen soils can keep the temps cooler than the models are predicting and snow keeps falling above 6,000 ft !!!
In Idaho, rain-on-snow runoff events happen below 5,000 ft from mid-Nov to mid-Feb. We’re step-up nicely for rapid runoff if the rain intensity and duration occurs because of valley snow cover and frozen soils. Soils in my backyard are frozen deeper than my shovel can easily dig. What’s happening in your backyard ?
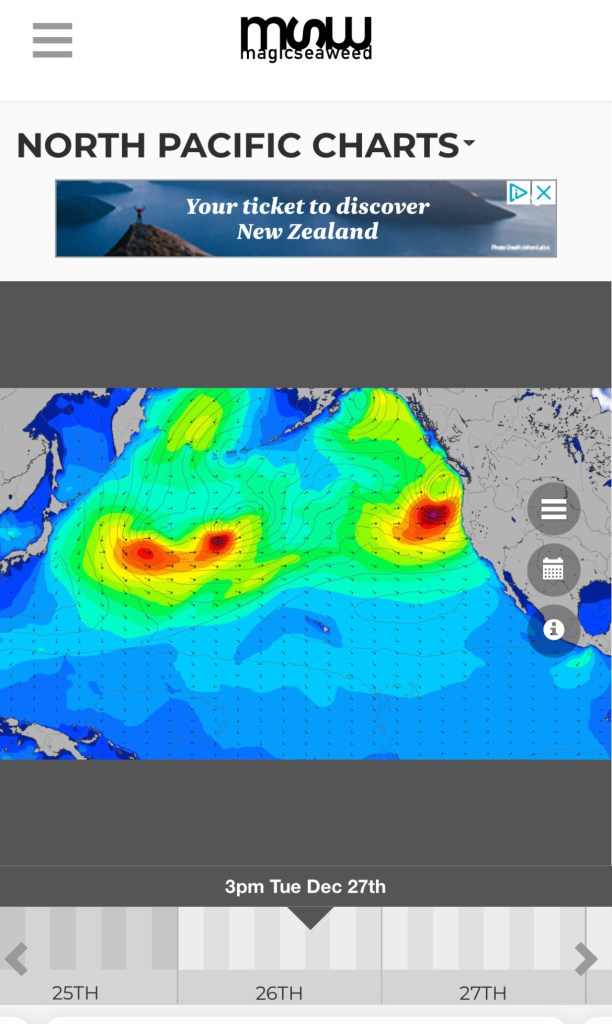
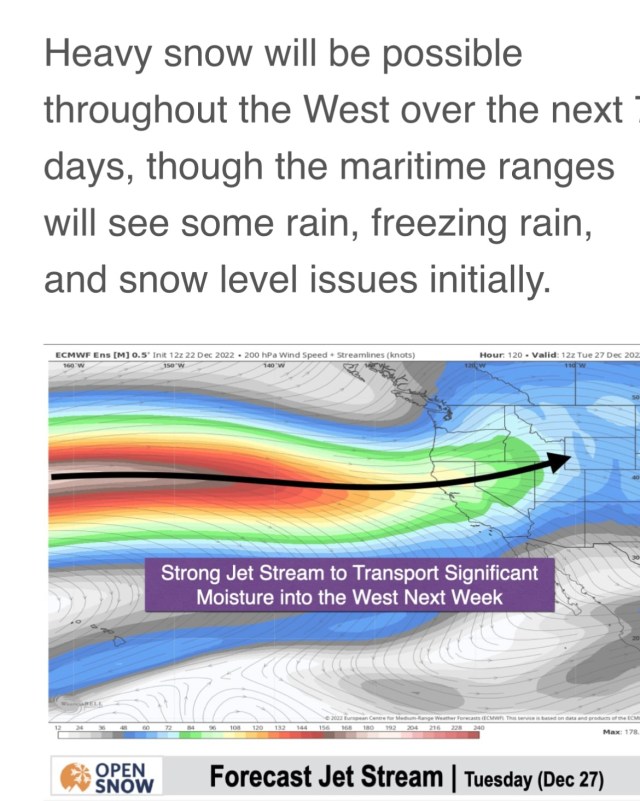
It’s always interesting to watch these storms set up as they cross the Pacific, the ocean swells they produce and becomes an Atmospheric River when they hit the west coast and move inland.
Get ready to enjoy the ride from this AR ! Be safe whether you’re deep in snow on a mountain side as avalanche danger will increase from this heavy snowfall on the colder lighter older snow layers OR if you’re watching the creeks and rivers rise in the valley bottoms! How high the rivers rise depends on duration / intensity of rain and temps above 32F.
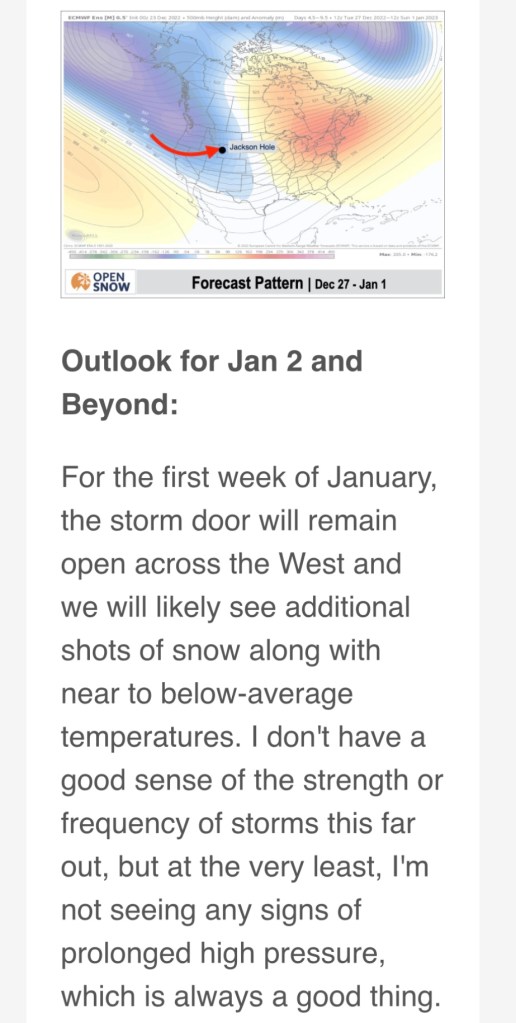
The good news from OpenSnow mentions the weather door in PNW may remain open in early Jan to start the New Year !!!
Above NWS hourly temp and precip outlook for my Boise house and for Bogus below.
Now to answer the question everyone has been asking… This is the best start at Bogus since 2002 and best at Brundage since 2015! This analysis is based on Dec 15 snow data. Keep in mind Bogus’s daily SNOTEL record starts in water year 2000 and Brundage in 1986. Snow depth sensors were in installed in late 90s early 2000s.
Comparison years may change to the better with more storms coming next week and before the new year starts! Here’s the details and forecasts follows…
Below are Bogus & Brundage Dec 15 Snow Water Equivalent (SWE) values sorted high to low. Snow depths are included if the depth sensor was installed in that year.
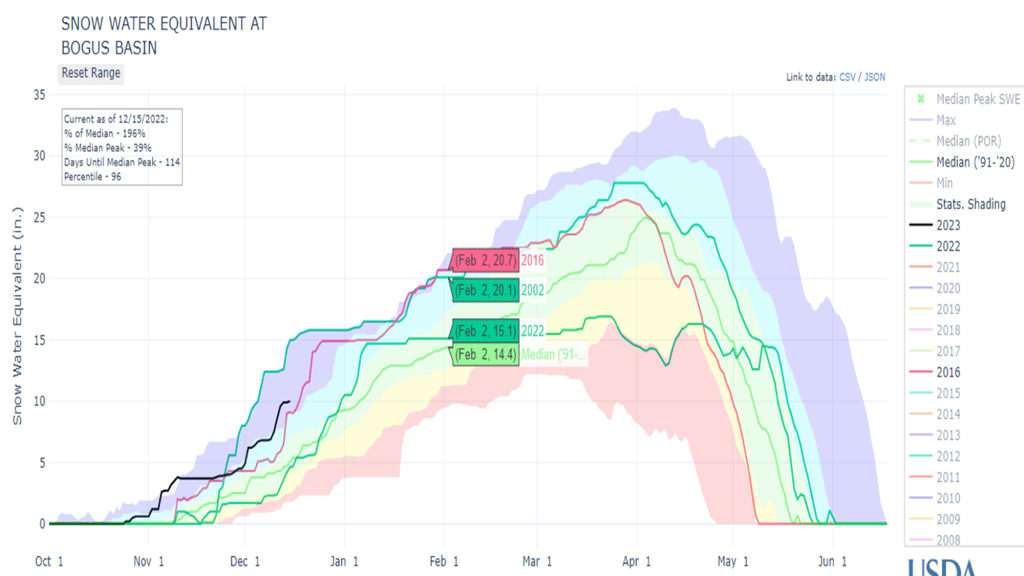
Bogus Basin’s Dec 15 SWE & Depth are 10.0” and 46”, highest since Dec 15, 2001 when there was 15.0” of SWE with depth of 61”. Wow, that was good year!
Keep in mind the water year is the year designated in graphs below and runs from Oct 1 to Sep 30. So this water year is for the winter of 2022-2023 and is called water year 2023.
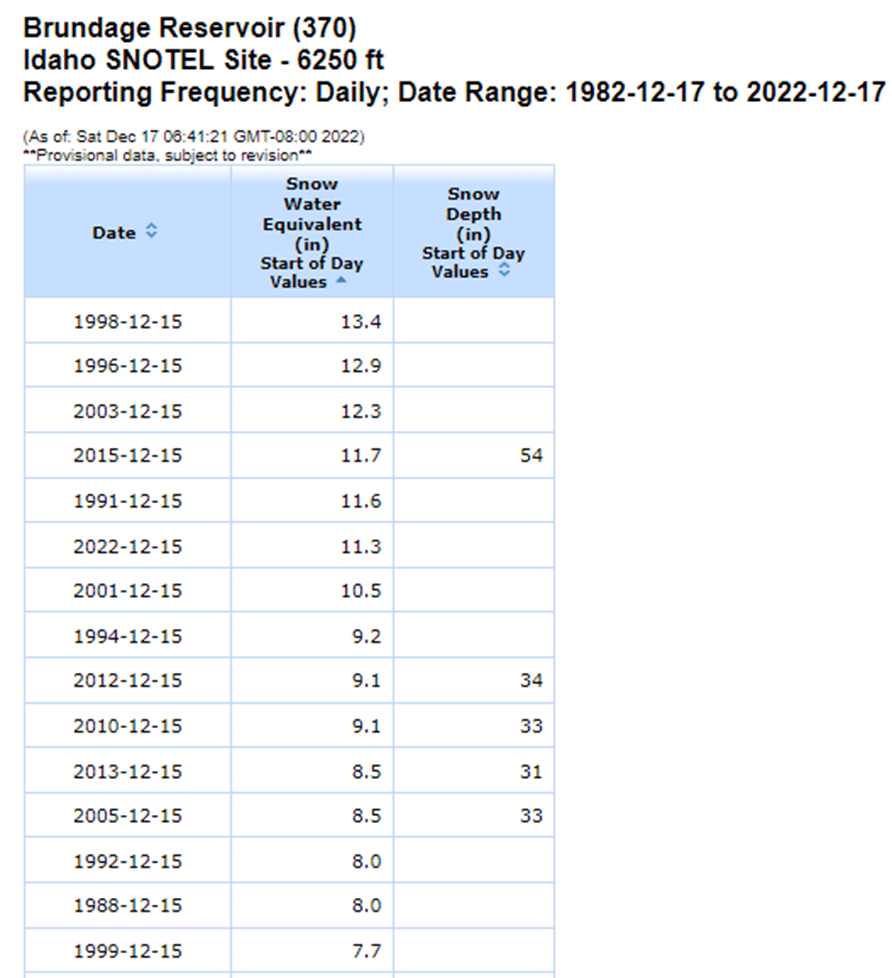
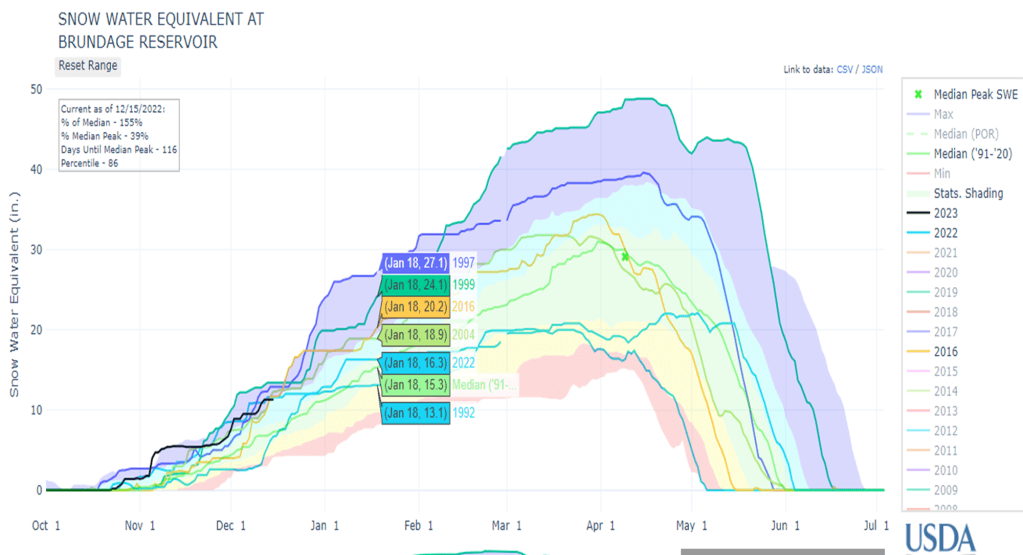
Brundage Reservoir SNOTEL site on Dec 15 had a SWE of 11.5″ with an estimated 45″ of snow depth, best since 2015 and 6th highest since records start in 1986. Top 5 years with more SWE on Dec 15, in order, are 1998, 1996, 2003, 2015 and 1991 followed by 2022. Remember those good wet snowy cold years in the mid to late 90s.
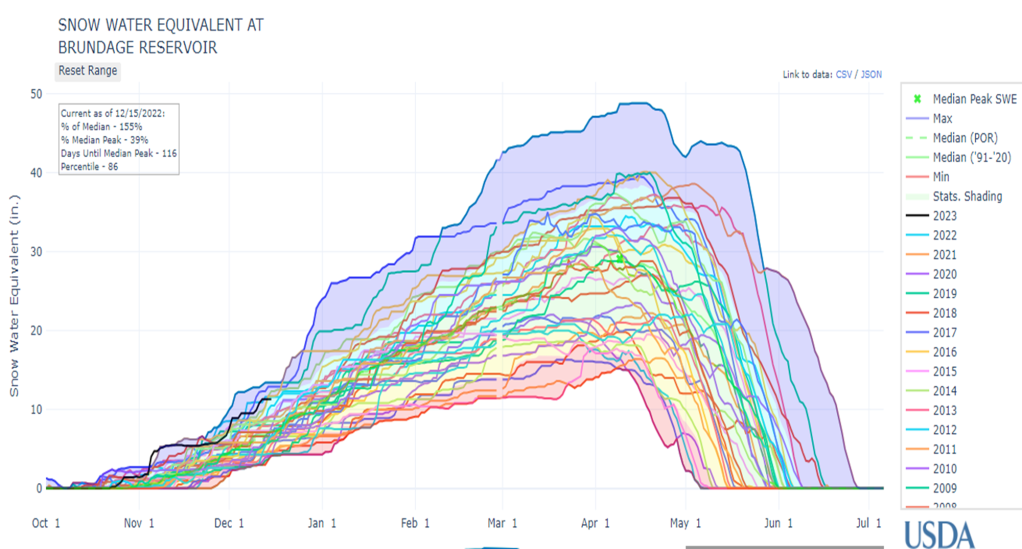
Busy but interesting graph above showing the SWE for all Bogus Basin years for the winter accumulation and melt season.
Bogus Basin time series SWE graph below shows 2002 with highest SWE on Dec 15 and this year, 2023 in black, with a little less and a bit more than 2016. Last year, 2022, is included to see how flat (dry) the SWE line was after Jan 1 and until the the wet weather returned in March/April to push the melt out later than normal. This means you should ski now and don’t wait for next Pow day. It is always interesting to see how close the SWE lines are in January for the different years and how what happens in January typically to determines the outcome trends for rest of winter. Later, we’ll talk more on last year’s dry Jan & Feb spell that also bled into March and if this is likely to happen again this year.
Similar with Brundage Reservoir you can see this year’s SWE, 2023 in black, is 6th highest with higher Dec 15 amounts in 1998, 1996, 2003, 2015 and 1991. These are actually Water Years – 1999, 1997, 2004, 2016, 1992 and 2023 this year.
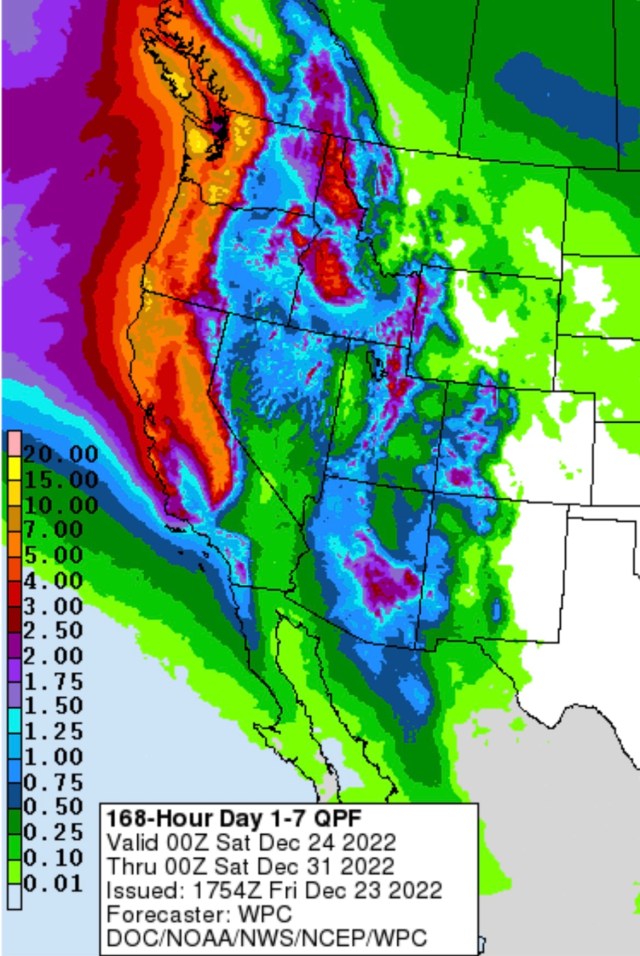
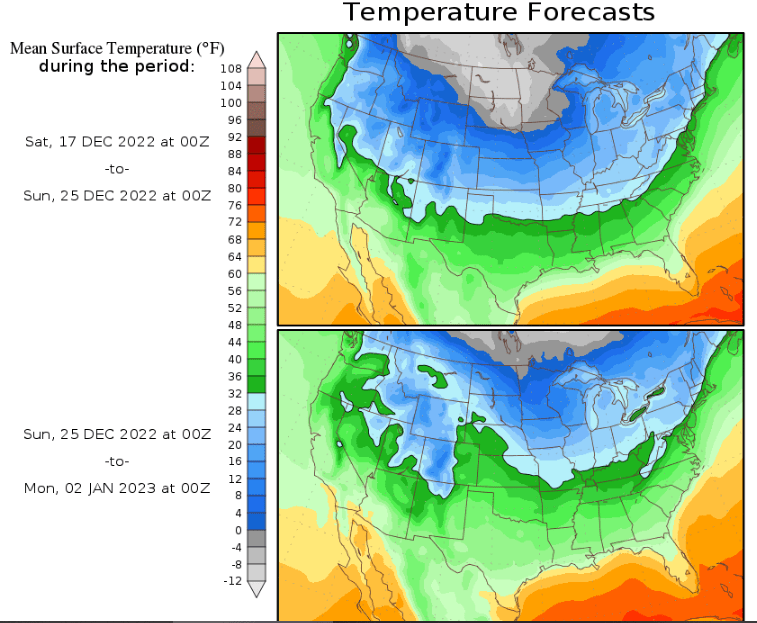
With a break between storms of blue skies and cold temps, it’s time tune & wax those boards for when the moisture returns. These two 7-day precipitation forecasts show more moisture coming the 2nd 7-days. Lets hope it stays on the radar for Santa’s arrival and beyond.
Top temp map shows cold temps upon us now with 7-day average temps averaging -12F in the mid-west and less cold the 2nd week, Dec 25-Jan 2. Remember cold is good, don’t let anyone kid you.
For the many years/decades I’ve been watching these 7-day forecasts, its interesting to point out that this 7-day temp anomaly for Dec 17-25 is one of the first times that I have seen so much blue & white and so little red that signifies above average temps. Cold is good.
Thanks for reading and if still looking for a stocking stuffer – check out Airflare. An inexpensive phone wilderness rescue app that can be used by rescuers to determine your exact location. https://airflare.com/
A major cold front decreased temperatures allowing precipitation to fall as snow above 6,000 to 7,000 feet rather than as rain to bring an end to this unusual June Atmospheric River event. Unfortunately, our neighbors and friends to our east in the Greater Yellowstone area and Red Lodge area received higher rainfall amounts that combined with snowmelt to produce historic runoff amounts primarily on the eastside of the continental divide. Our thoughts are with you as continue to dig out and rebuild.
Temperatures, in Idaho’s west-central mountains at SNOTEL sites like Jackson Peak at 7,070 feet, reached highs of 60-65F for several days prior to June 11 and above freezing nighttime temperatures allowed the snowpack to melt 24/7. On June 11, the temperature reached 63F at 2pm and gradually decreased to 32F by 3AM Monday morning June 13. Sunday Jackson Peak received 1.5 inches of total precipitation as temperatures played a critical role allowing the precipitation to change from rain to snow in the higher elevations. These near freezing temperatures also slowed the snow melt that was feeding the streams prior to the storm. Temperatures remained in the 30s until noon Tuesday, June 14.
Monday morning, we headed north, packed the Subaru and dog (got 35.5 mpg traveling 870 miles in two days). You could see the new snow from Tamarack Resort to the Seven Devils range and in the Selway-Bitterroot mountains on Tuesday. What a beautiful site with green valleys below.
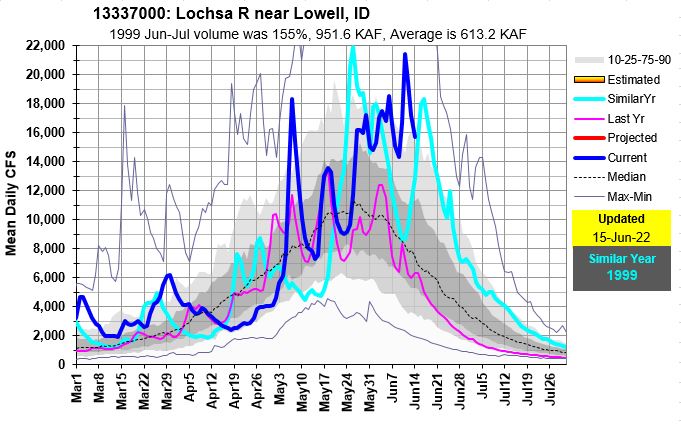
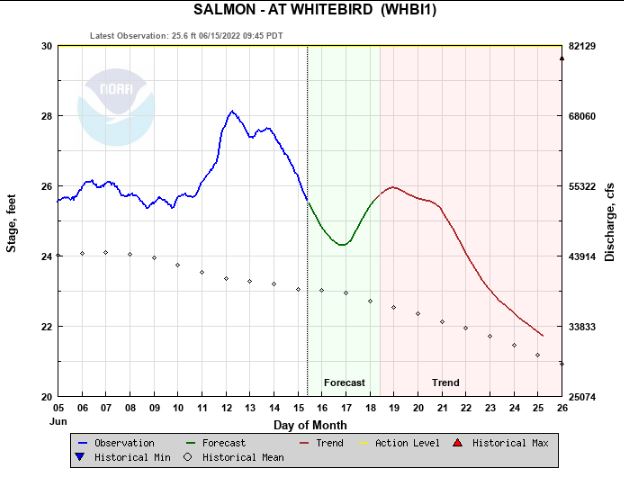
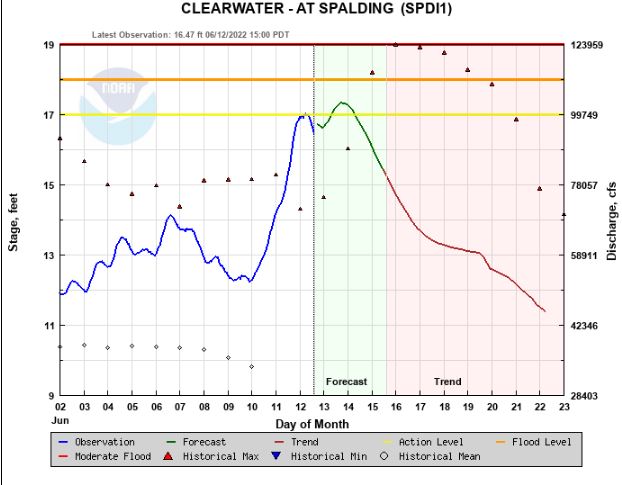
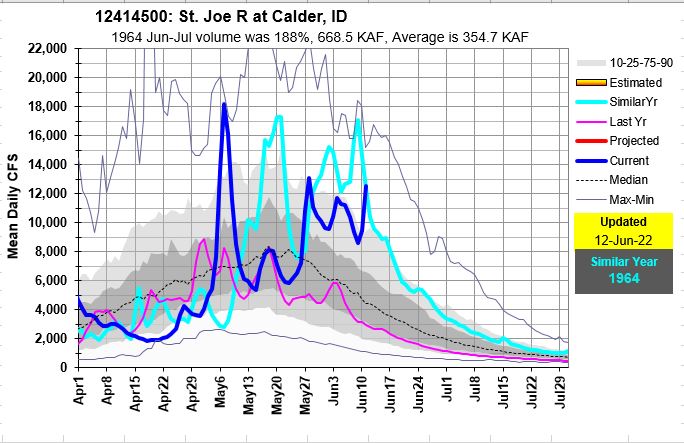
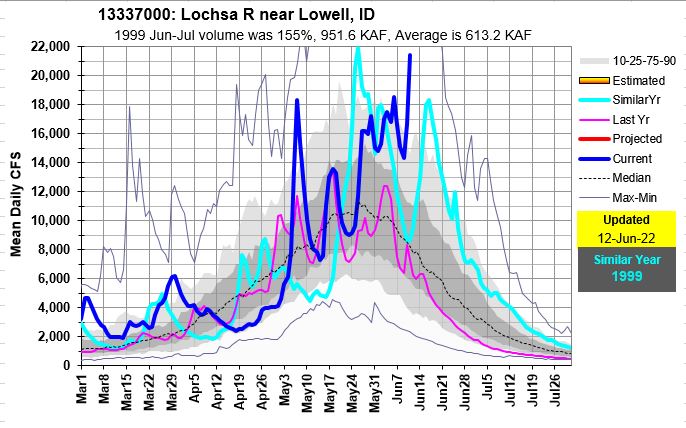
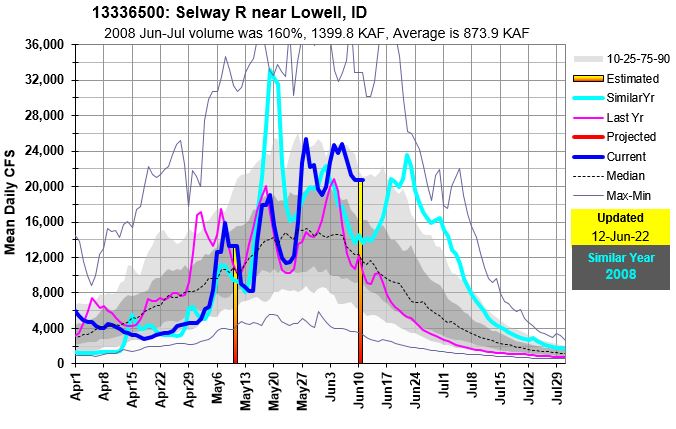
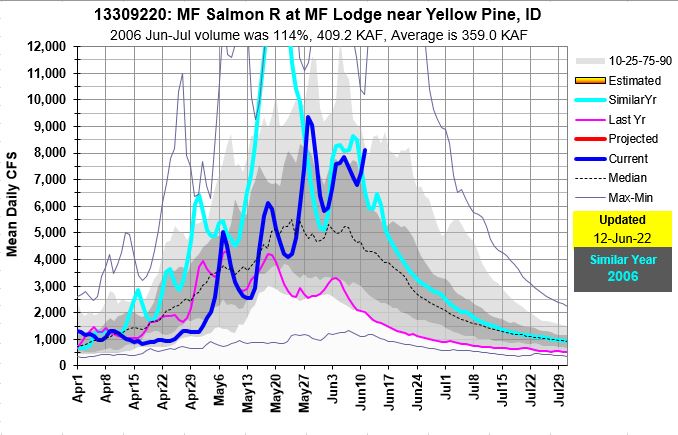
These freezing night temperatures slowed the melt as rain subsided forcing streams to peak lower and recede earlier than streamflow models were trending. Rain turned to snow to melt later which will help extend recession flows. This is good news as many were running bankfull and approaching record flows for this time of the year in the Clearwater basin.
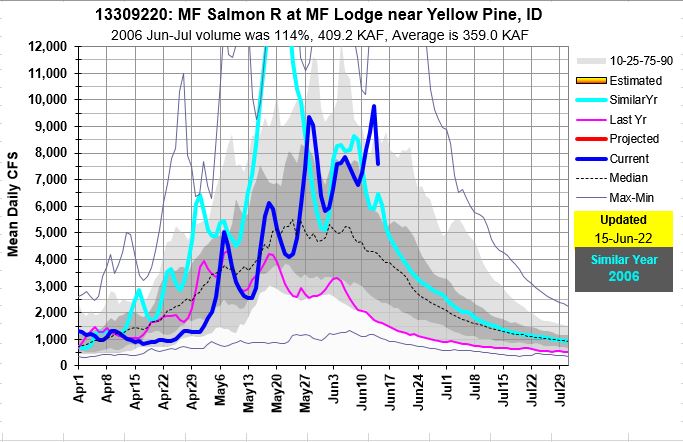
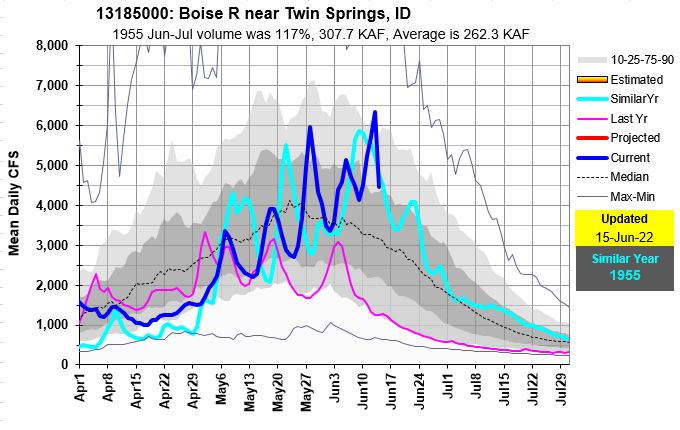
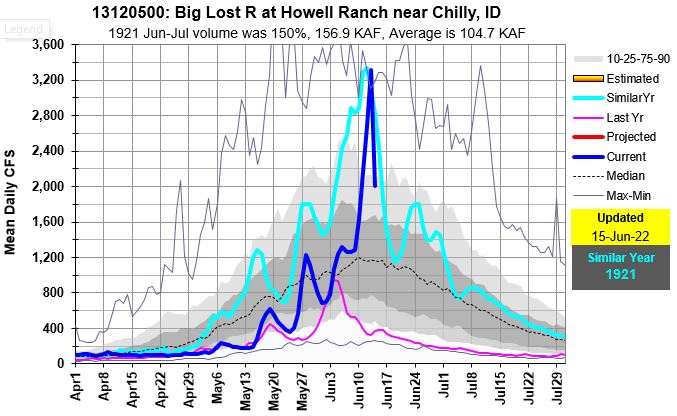
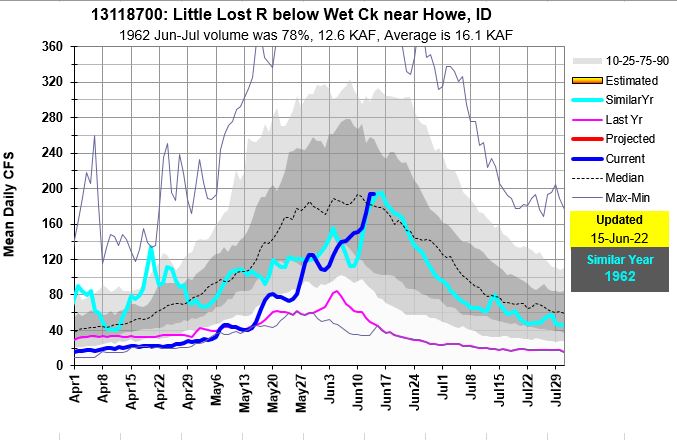
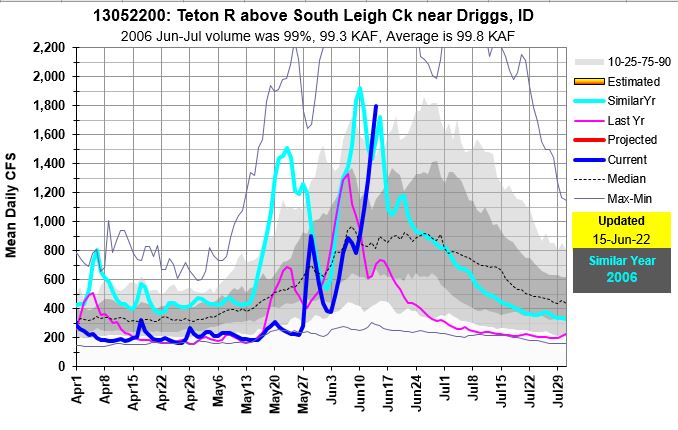
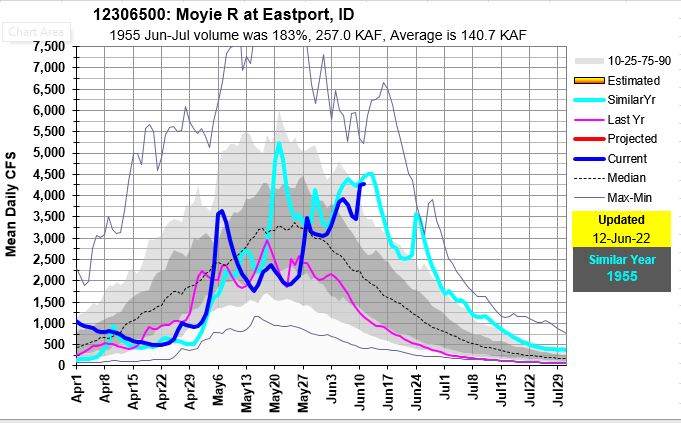
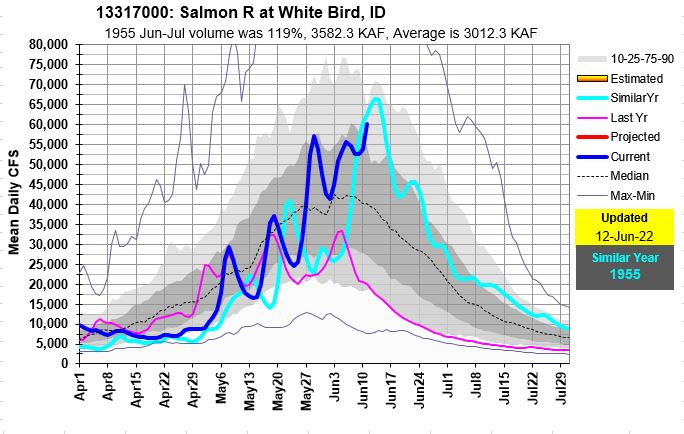
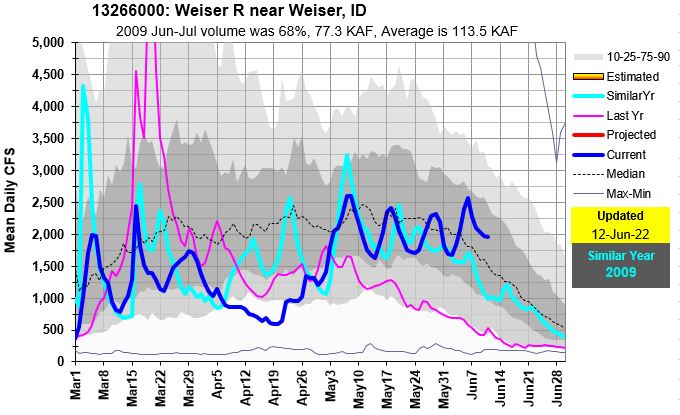
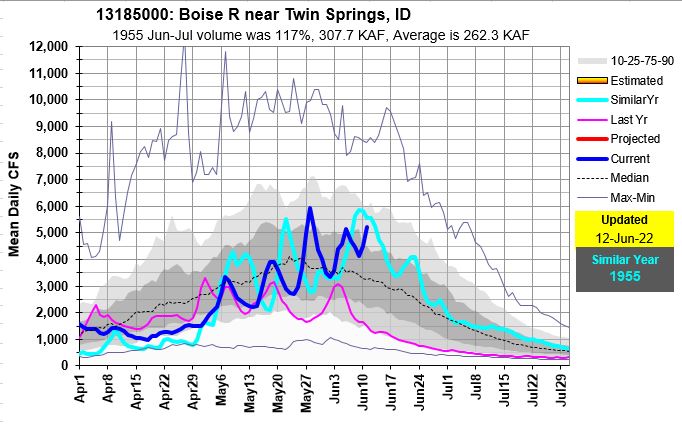
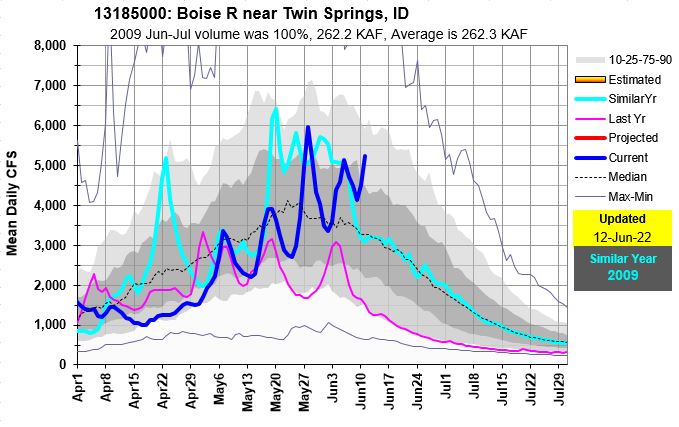
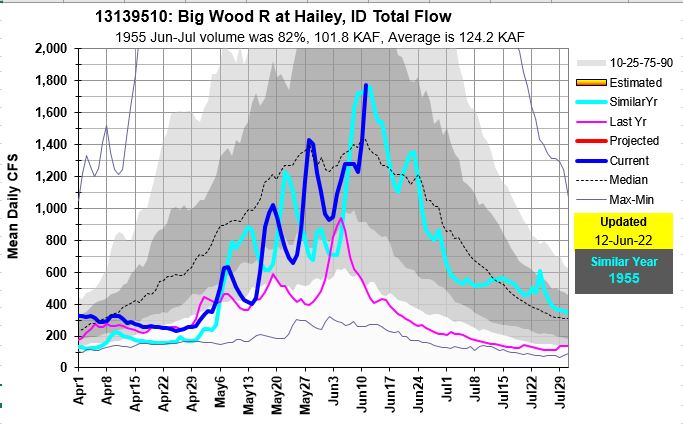
Following are current flow graphs showing this year, last year and similar year based on current flow. I included the Wood and Lost rivers, our next road trip that starts today. Who’s in or wants to talk rivers in the Ketchum area this weekend?
And post by Cliff Mass about why thunderstorms develop over mountainous areas. Cliff is from Seattle and his long range PNW temperature forecasts were right on for this area too. Not sure who to reach out to about Idaho tornadoes because we don’t have many. https://cliffmass.blogspot.com/2022/06/why-do-thunderstorm-prefer-mountains.html
Be safe as rivers are still running high and flowing fast with swift currents and strong eddies that are fun to watch from a distance. Rivers are bankfull with steep drops into the cold water. Know your river running limits if you are putting on the river. If you are a fair weather floatier, I’ve seen two forecasts that says warm, dry, hot weather will arrive for the last 10 days of June. Be safe and enjoy another cool, wet weekend!
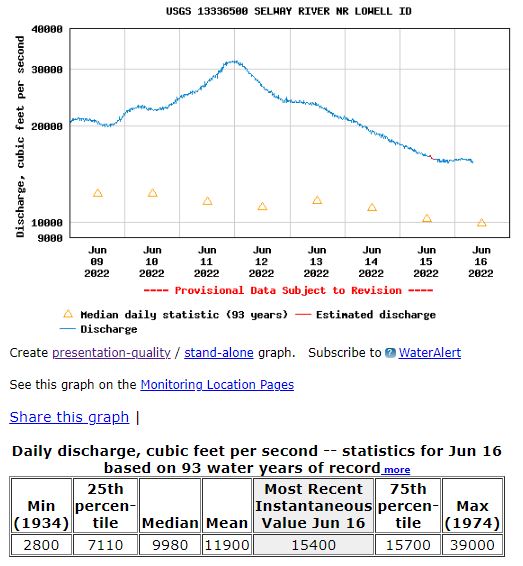
Major increase followed by decrease from cooler temperatures. 1974 was a huge snow year with record high flows.Some missing data…
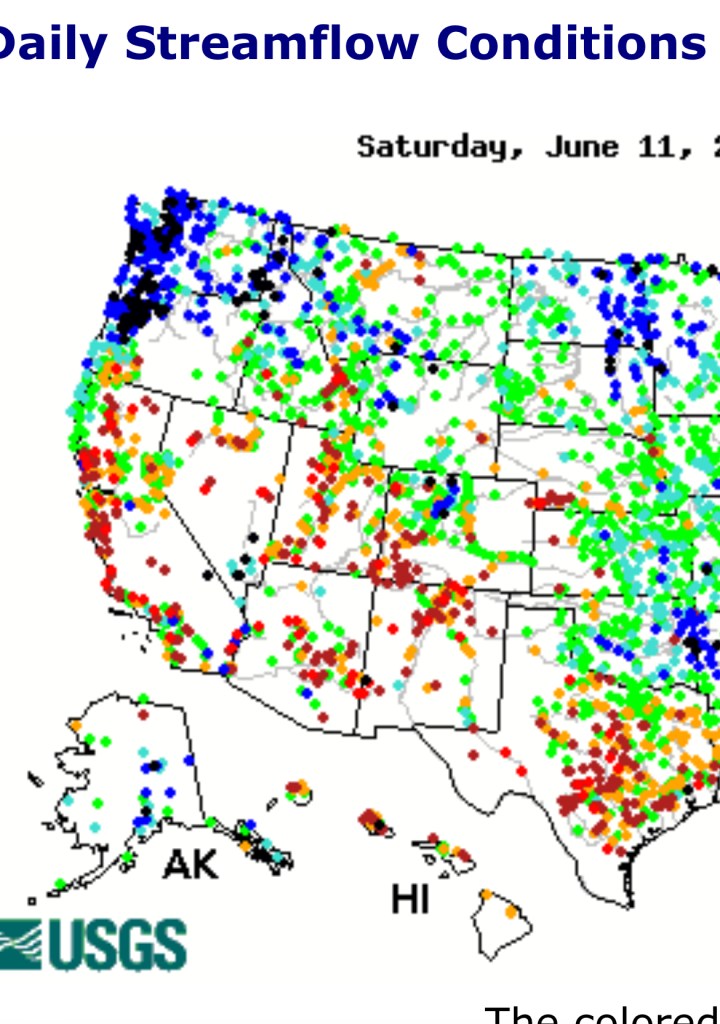
Saturday mountain temps were around 50F in northern Idaho allowing about a dozen SNOTEL sites to melt 1.5 to 3.0 inches of snow water in a day in addition to the 1 to 1.5 inches of rain that fell. End result – rivers are very high, some at record high. Clearwater R at Spalding is pushing 100,000 cfs, record high for today based on 50 years of data. More rivers will continue rising after Sunday’s rain and snowmelt.
Flood control releases start Monday at 8AM for Boise R with flows at Glenwood Bridge going from 1250 to 2750 cfs by 10AM.
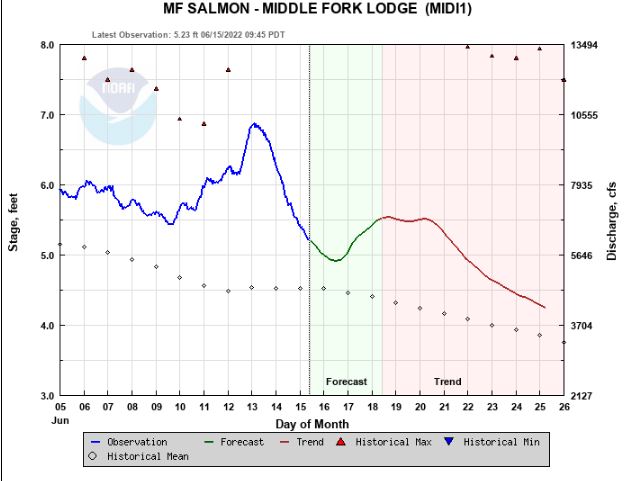
Here are few graphs to illustrate how high these flows are compared to historic exceedances, and max levels that show this year, last year and similar current flow year.
These current USGS flow conditions map for today and yesterday are always cool to watch as the wet basins move across the nation. Black pins represent record high flows. I’m sure we’ll see more in Idaho tomorrow. https://waterdata.usgs.gov/usa/nwis/rtLink to NWS Forecast Center for streamflow forecasts/trends. https://www.nwrfc.noaa.gov/rfc/hydrographs/