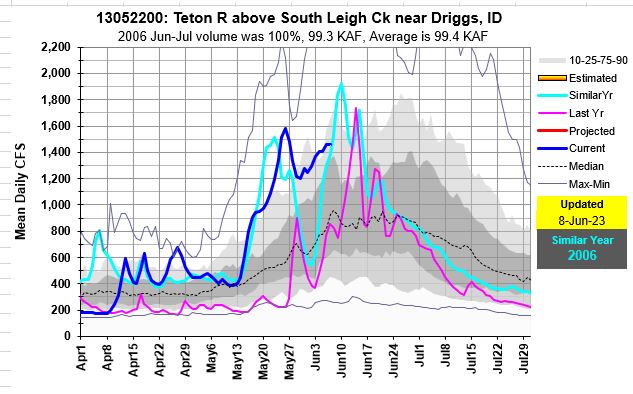
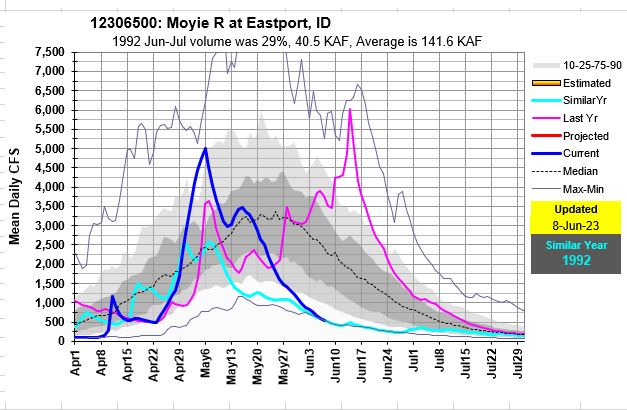
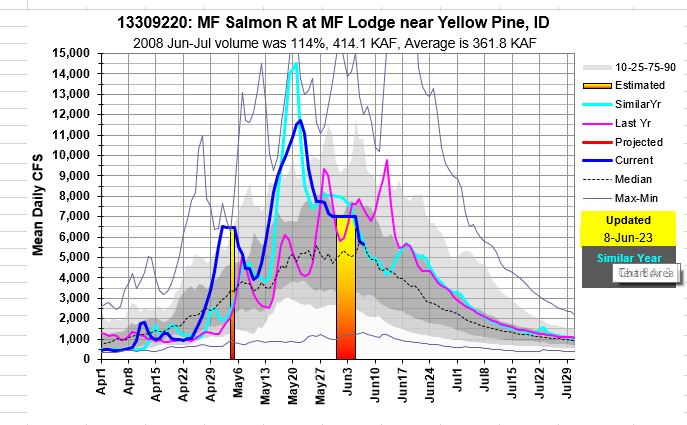
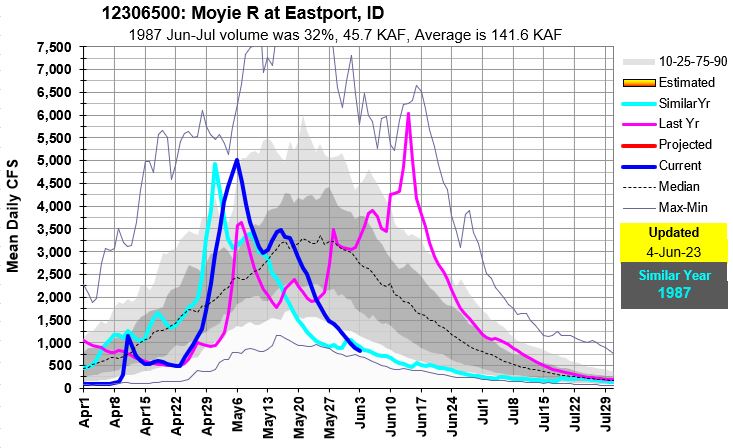
The Teton River is just reaching its snowmelt peak while the Moyie River is flowing near record low. The Owyhee River is just now reaching the tail end of recession flows. Central Idaho’s rivers are receding from their snow driven peaks. May brought warm temps with above freezing nighttime that resulted in 24/7 meting and probably record high SWE loses during the month of May because there was plenty of snow to melt. June’s cooler and wetter weather will help push recession flows out a bit before the normal low flow summer levels arrive. Owyhee and Bruneau recession flows months are a good example of these extended flows. Enjoy the river, know your limits and keep your eye on the weather and those river flow levels.
Snowmelt peaks flows have passed but June rains can generate additional increases. Didn’t realize the Moyie River is flowing near record low and exactly the opposite of 2022.
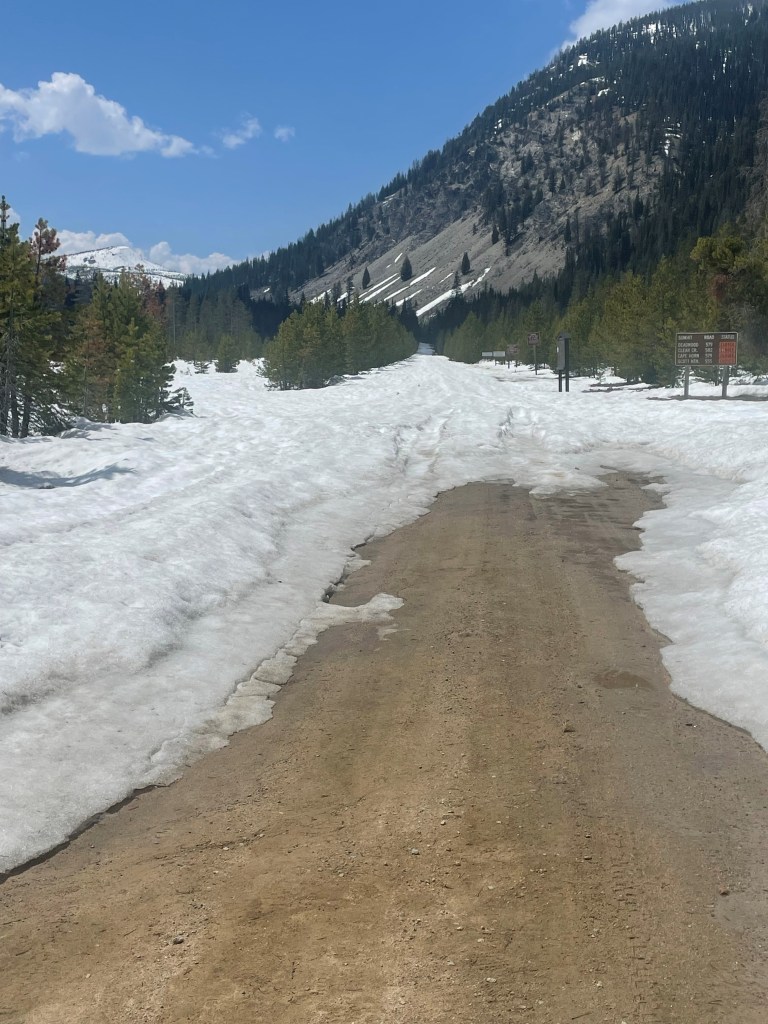
With snowmelt rates at 1.5-2.0″ a day for several days streams are reaching their peaks just as cooler temps arrived and snow starts to runs out a few sites. But as observed in the Owyhee and Bruneau Rivers, rivers stayed higher longer probably as a result of the good mid-elevation snow that feeds ’em.
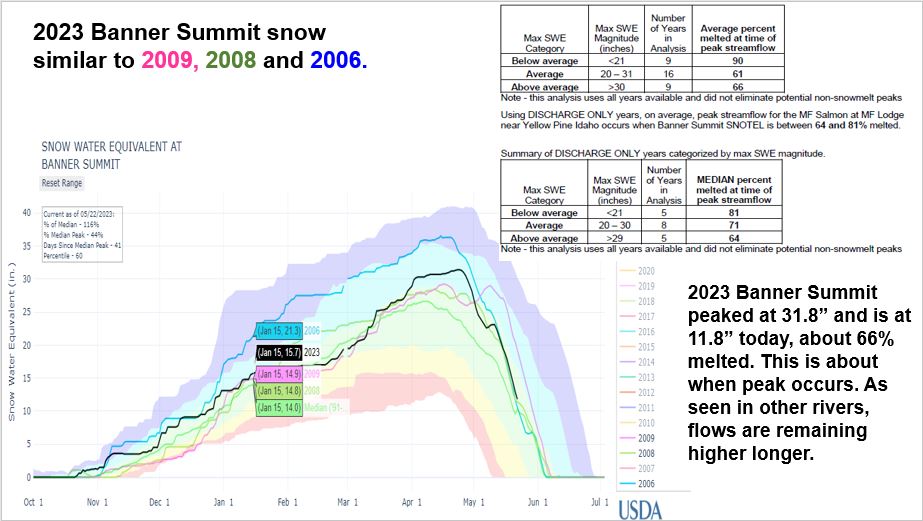
Boundary Creek Road May 19, 2023 with 15″ SWE at Banner Summit.
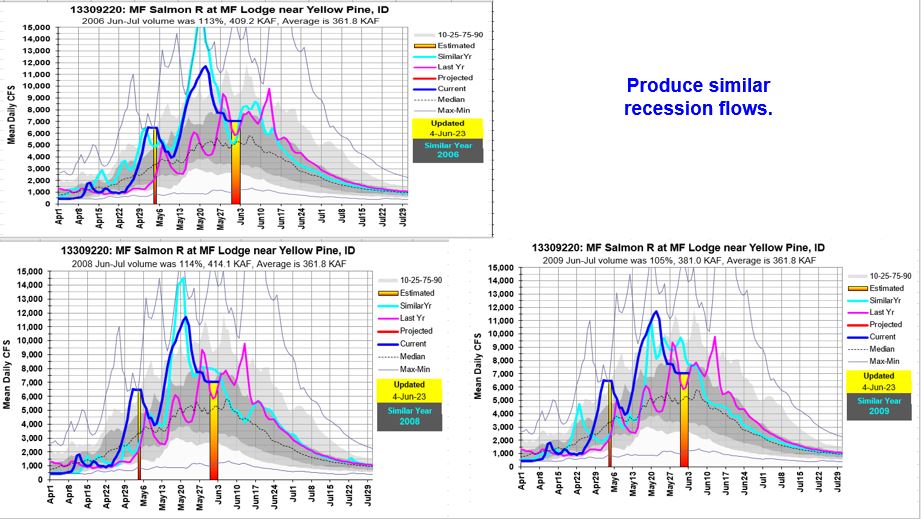
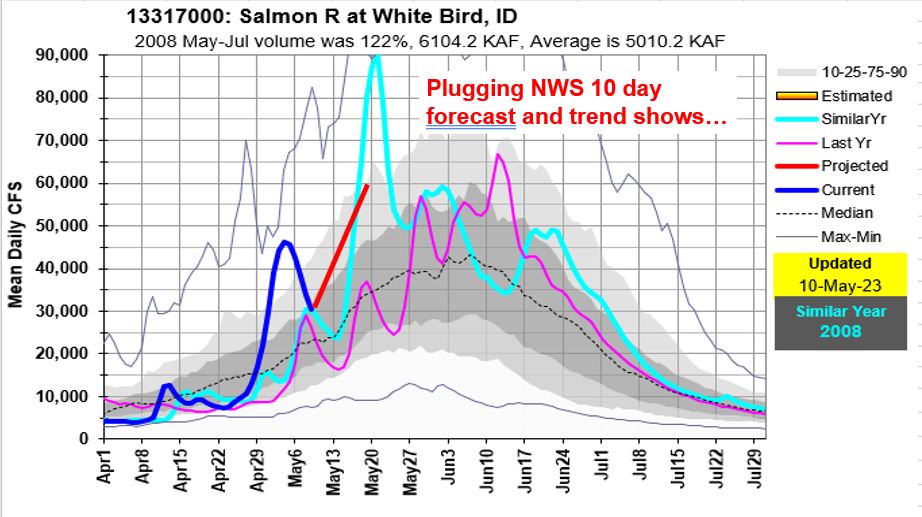
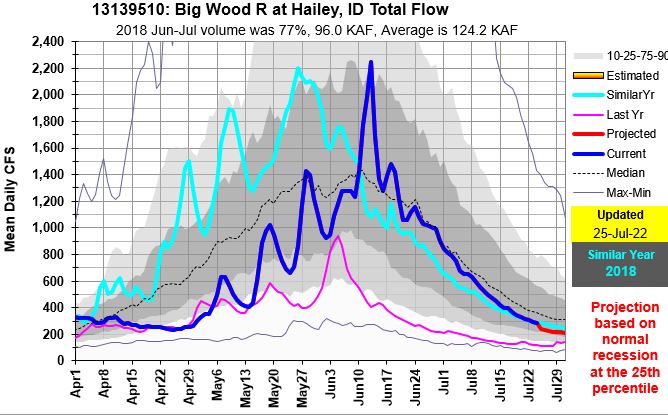
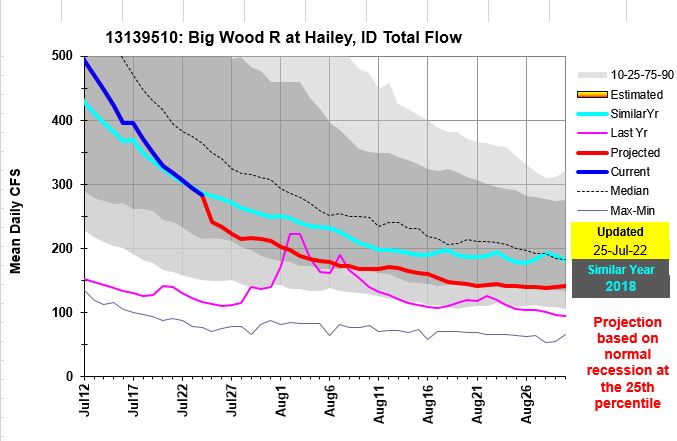
The heat is on and will increase snow melt rates from higher elevations that are now feeding the streams. Following are similar snow years and resulting streamflow with comparisons to this year’s volume forecasts.
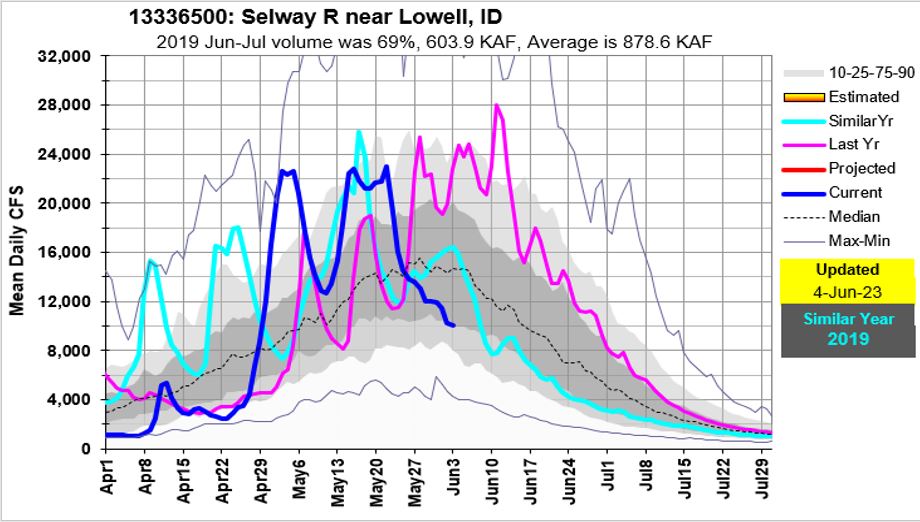
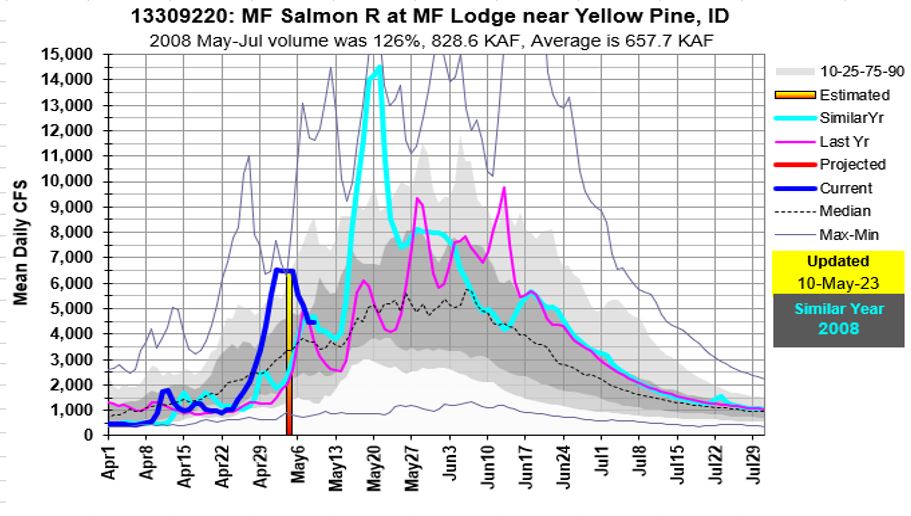
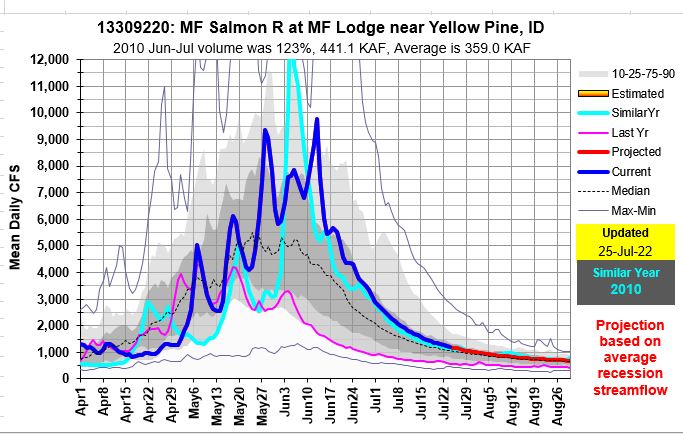
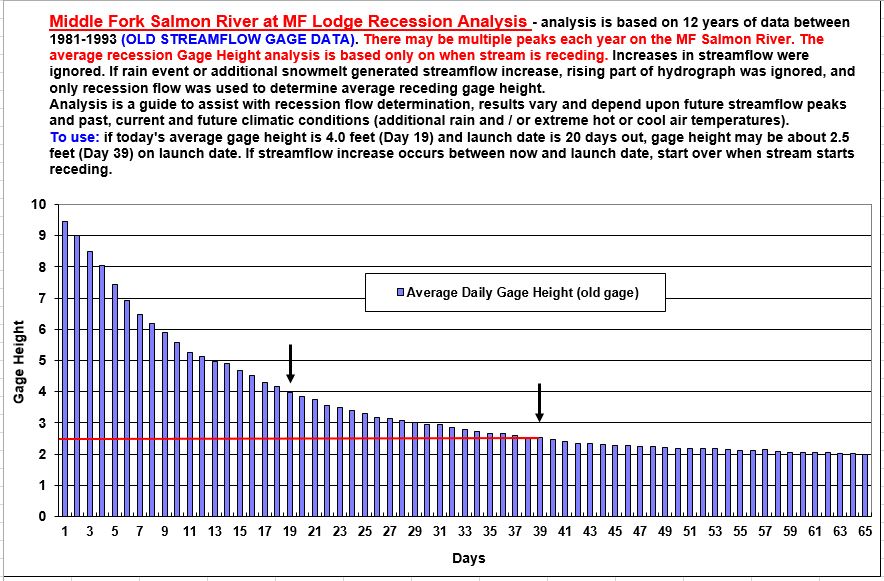
Did you get lucky and get a permit for the MF or Selway Rivers? Here’s a tool developed a while ago by Peter Palmer, Ron and crew, and it still works. Because Mother Nature melts the mountain snowpack that feeds the streams consistently (elevation, south and north facing slopes, and even burnt areas) from one year to another, the end result is snowmelt recession flows are consistent from year to year. Try using the graph to see what the flow might be on your future launch date to better understand potential river flow levels while also considering your risk level and boating skills.
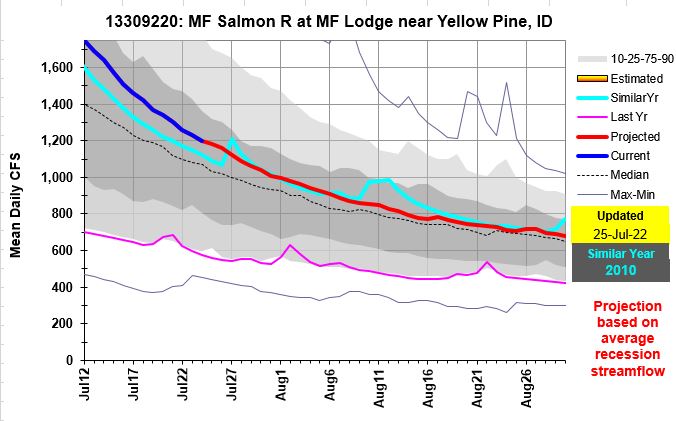
It is designed to be used after the peak flow has occurred AND the river is in full recession. This is OBSERVED by watching the decreasing flow levels on the recession side of the hydrograph. If there is a future river peak from rain or additional snowmelt, just start over when the river starts receding again. The data used to develop the nice sloping curve is based only on when river flows were receding.
Give it a try and let us know how it worked to help predict your flow level on your launch date. These could also be helpful on other rivers to help monitor water right Day of Allocations, water right cut dates, critical low flow and more because of these consistent snowmelt / recession flow relationships that occur every year based on how the snow melts.
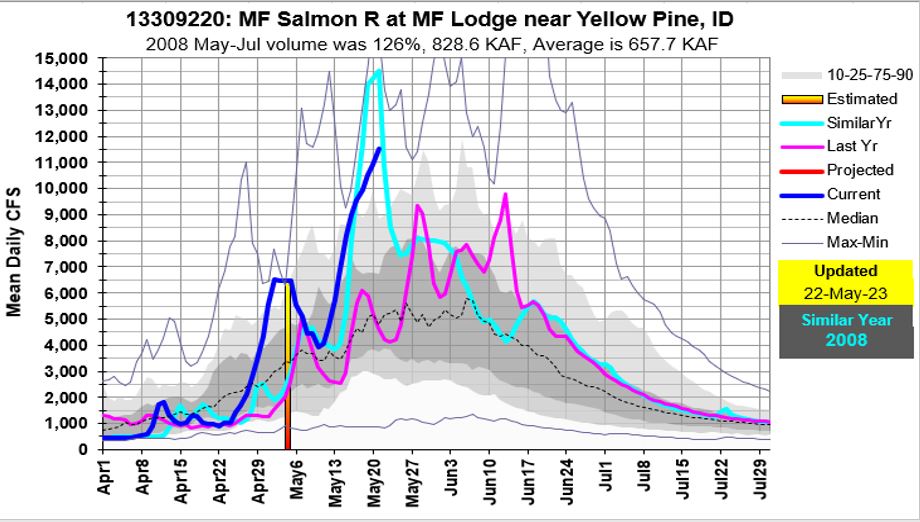
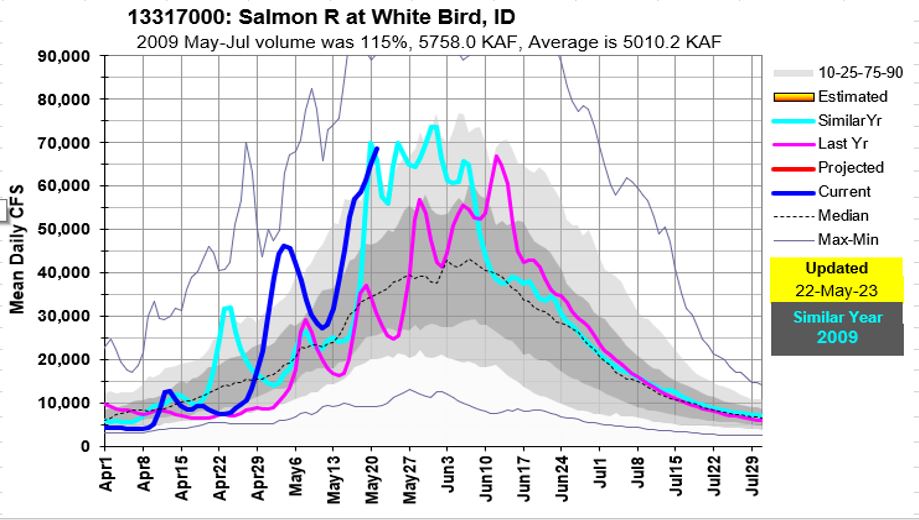
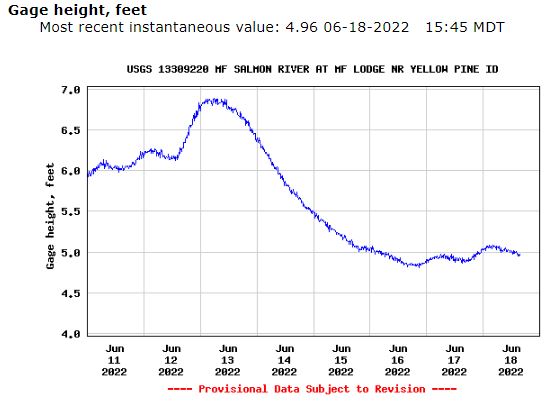
These two hydrographs show the MF Salmon and Selway Rivers ARE NOT in full recession because the current flow is holding steady or increasing from the warmer temperatures and /or remaining snow. The previous fast decrease in flow was a result of cooler air temperatures slowing melt and not because of the higher elevation snow that feeds the streams gradually being depleted. It is always cool to watch the diurnal snowmelt fluctuations each day as temperatures warm during the day and cool at night and impacts of as major cold fronts move through. This could be another post about what the timing of these daily diurnal snowmelt peaks really mean.